
UK Mobile Trade-in Market Analysis
Strategic investment guide to market evolution in the circular economy

Following on from the UK Device Protection Market1 study I thought I’d develop a current and future view of the UK Trade-In market to provide a baseline which I can continue to refine over time. I’m using some of my data captured from previous studies, some of the CCS Insight and IDC data (graciously shared at the Circular Summit in October ‘24) and a few more assumptions to illustrate a couple of scenarios.
If you’re thinking about new or additional investment in this space, this work may provide some guidance.
Baseline Assumptions
As in my article on the New & Refurbished Balance Point2, I’m happy to use an installed UK smartphone base of 48M devices3. The July (2024) YouGov survey4 suggest that 6% of the installed base are refurbished devices, that’s 2.88M devices. I estimate new annual device sales to be approximately 10.15M units based on carrier and retailer equipment sales and a weighted average iOS and Android price. Carriers account for 7.9M units and retailers (including Apple and Samsung) about 2.25M units. We’ll take my survey results which recorded approximately 16% of consumers are buying refurbished5 devices which is about 1.95M units per year. Finally we’ve got the current average primary use phase or lifecycle at approximately 3.5years6.
Current Size Estimate
There are several challenges here (maybe not for IDC and CCS) based on the fact that a) many of the larger organisations do not publish unit data and b) many of the independent specialists are small and don’t need to file an income statement.
However, there are a couple of things going in our favour: a) some of the carriers publish unit data as part of their sustainability reporting and b) we have a good idea about demand which, despite supply constraints, the sector is just about managing to meet.

I’m using a weighted device ASP of £376.25 from the IDC Circular Summit Presentation which gives us the Total Market (Demand) Value of £733.7M. I’m using a 16% gross margin value which is an approximate benchmark from my trade-in company analysis. That suggests there’s a total of £117.4M gross margin available at the current demand rates.
Drivers of Future Value
Happy to consider others, but I think these are the current main value drivers:
Carrier GSMA Targets: a number of operators (including BT and Telefonica) have signed up to the GSMA pace-setting targets including a trade-in “attachment rate” of 20% of new devices distributed7.
Installed Base Potential: Shifting the installed base from 6% to the 16% current sale percentage is going to take approximately 3.5 years8.
Primary Use Phase: extending the primary use phase from 3.5years to 5years will impact sales of new and refurbished devices and the associated trade-in.
Trade-in Value: CCS predict that the average trade-in value will increase to £470 by 20269.
Market Potential
The table below shows how extended lifecycles could reduce the market value, how trade-in price increases have a relatively modest impact compared to volume drivers, the GSMA carrier targets alone represent significant growth and the installed base penetration having massive upside, I’ve used the 16% market share, but also added another 25% target because I can envisage a scenario in which a quarter of devices sold annually are refurbished, perhaps not by 2030 though.
In the first scenario, even maintaining the existing device ASP, the market value grows from £295M to £595M with an increase in available gross margin of £47.9M this represents a 12.4% CAGR over the period to 2030. If the ASP increases simultaneously, the CAGR increases by an additional 2.5%.
Increasing the installed base by continuing to sell refurbished devices at the current assumed rate of 16% means a total market value of £2.89B and an additional £345M of gross margin, other variables remaining constant.

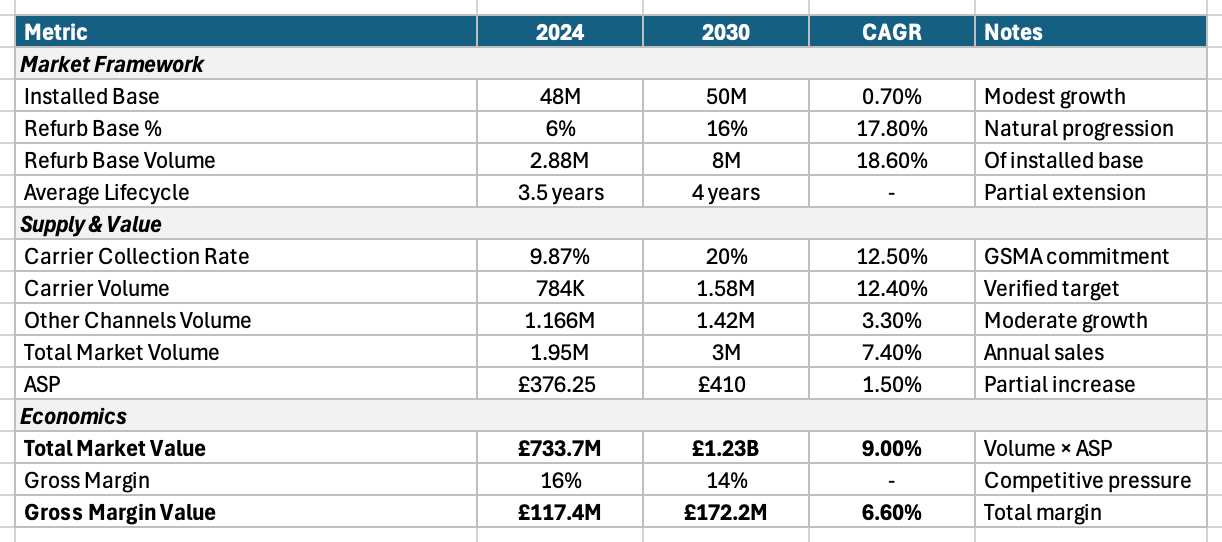
In terms of the most likely scenario, I’ve put together the table below. This illustrates a 2030 market value of £1.23B and an available gross margin of £172.2M. The scenario includes a modest growth in the installed base from 48M devices to 50M devices, the stated increase in the carrier collections to meet the GSMA target and margin compression due to the competitive impact. This results in a 9.0% CAGR for the total market and a 6.6% CAGR for the gross margin.
Strategic Implications
In order to hit the GSMA target carriers will need to more than double their trade-in volume, the management of which is currently outsourced to Likewize, Assurant and Ingram Micro. Adding another 796k units is possibly going to need infrastructure investment unless there’s enough existing spare capacity. Capitalising on the primary opportunity acquiring devices straight back from their consumers is going to require additional incentives and new approaches. This is where I can see higher trade-in values for longer contracts or upgrade and return programmes being given the hard sell (again). I wonder also if carriers might step in and stop the independents consolidating by making acquisitions of their own or tying them up in exclusive partnerships.
Independent traders and retailers would likely bear the brunt of any increased carrier activity. Those with scale may have some buffer, but even that is unlikely to offer much immunity from increasing competition. Differentiating the consumer transaction, focusing on the secondary opportunity, levering out those drawer phones somehow, may become a necessary speciality. Strengthening B2B2C models and/or partnering with carriers or retailers may provide required volume to remain independent. Adding new lines or switching focus to other consumer electronics may also provide better revenue stream options with better margin opportunities.
For manufacturers I’m assuming the bigger concern is likely to be revenue replacement from the drop in new sales as the refurbished market share increases. Capturing additional trade-in volume is going to be a vital part of that process. I don’t have any specific evidence, but anecdotally the Apple trade-in program already has very good return rates. Those rates will certainly need to be maintained. The hypothetical 25% market share for refurbished devices occurring over a 3year period equates to 2.6M fewer new device sales of which 1.43M would be Apple, that’s big bucks. Better to buy a refurbished Apple than none at all. Right? Combined with increasing primary use phases, it feels like manufacturer trade-in programs will be a hugely important consumer touch point.
Finally, subscribers may note my general sector consolidation narrative. I think the level of gross margin available from this revenue stream continues to support my view. If you’d like a reproduction of this exercise for any other markets, please drop a note in the comments or message me directly.
Peace.
sb.
USwitch make it 54m (https://www.uswitch.com/mobiles/studies/mobile-statistics/mobile-phone-market-statistics/#:~:text=United%20Kingdom,67). I make it about 48m, I’ll be cautious and take my number.
Taken from the IDC Circular Summit Presentation.
See note 2.
Taken from the CCS Circular Summit Presentation and converted using today’s rate.