


Telefonica Insurance Research Update
Consistent top line performance and declining profitability...

Whether you value the products or not (and millions globally do) the insurance companies protecting products in the mobile and consumer electronics sector are playing a part in developing the circular economy. Asurion, Assurant, Likewize and SquareTrade specialise and have extended their value chain capabilities to include trade-in, buy-back and in some cases, repair. There are also a number of large global and European insurers such as Aviva, Allianz, Chubb, Starr and Zurich that stick to underwriting, reinsurance and sometimes administration, outsourcing the rest. And then, there are a handful of captive insurance companies owned by carrier groups like Vodafone and Telefonica.
Captives can offer excellent sources of information. Being insurance undertakings, they have high levels of regulatory obligation and the financial transparency that goes along with it. They provide a guide to how their own device protection programmes are performing, which can be translated, with some assumptions and a bit of effort, into how the rest of the market might be doing. If you want to skip the numbers, feel free to scroll to the “Translating the numbers” section further down.
Recap
Telefonica Insurance was originally set up in Luxembourg in 2004 as Altair Assurances S.A., changing it’s name in 2011. In 2010 and 2011 branches of the insurance company were established in the UK and Germany and, in 2021 the company was re-domiciled to Spain.
There are two main sources of performance data: the annual insurance company accounts and the insurance company Solvency and Financial Condition Report (SFCR). There are some differences, so given I’m interested in general performance, I’ll use the annual accounts data with supporting management information from the SFCR.
Premium Performance
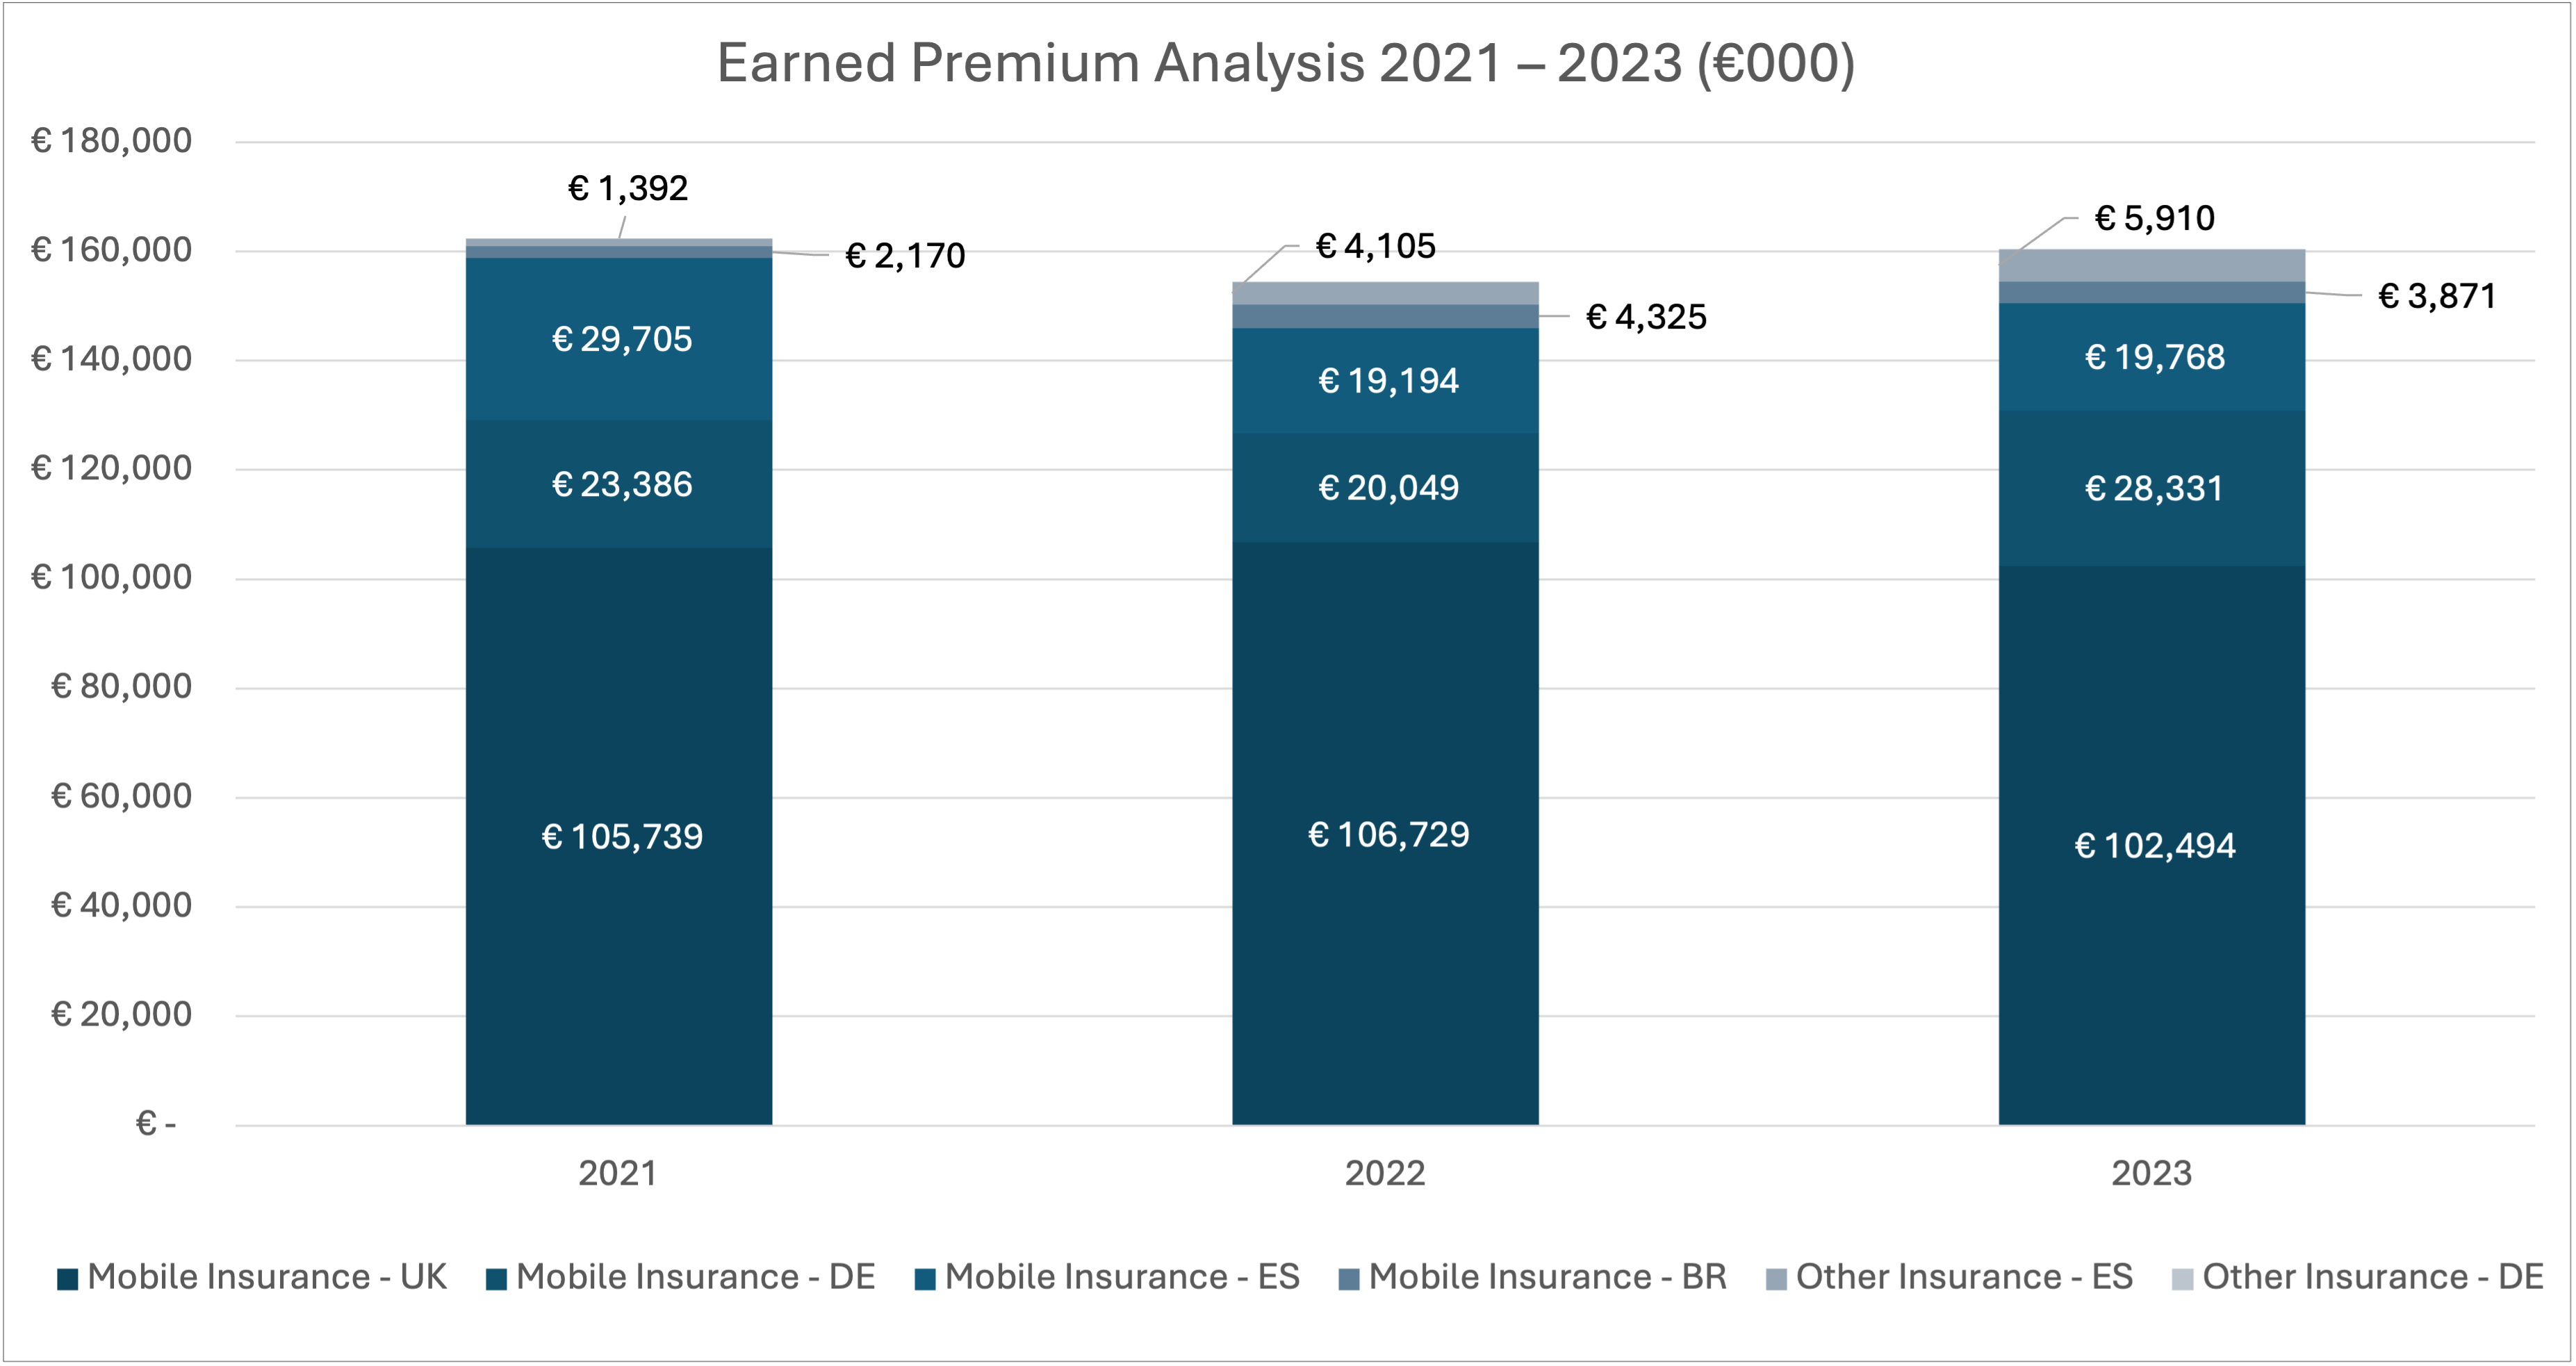
Over the last four years, insurance premiums have remained relatively steady, increasing 4.3% from €154m in 2022 to €161m in 2023 after a similar percentage decline between 2021 and 2022. Note the jump in revenues from 2020 to 2021 was primarily due to a change in accounting method (cash to accrual) as the entity moved from Luxembourg to Spain.
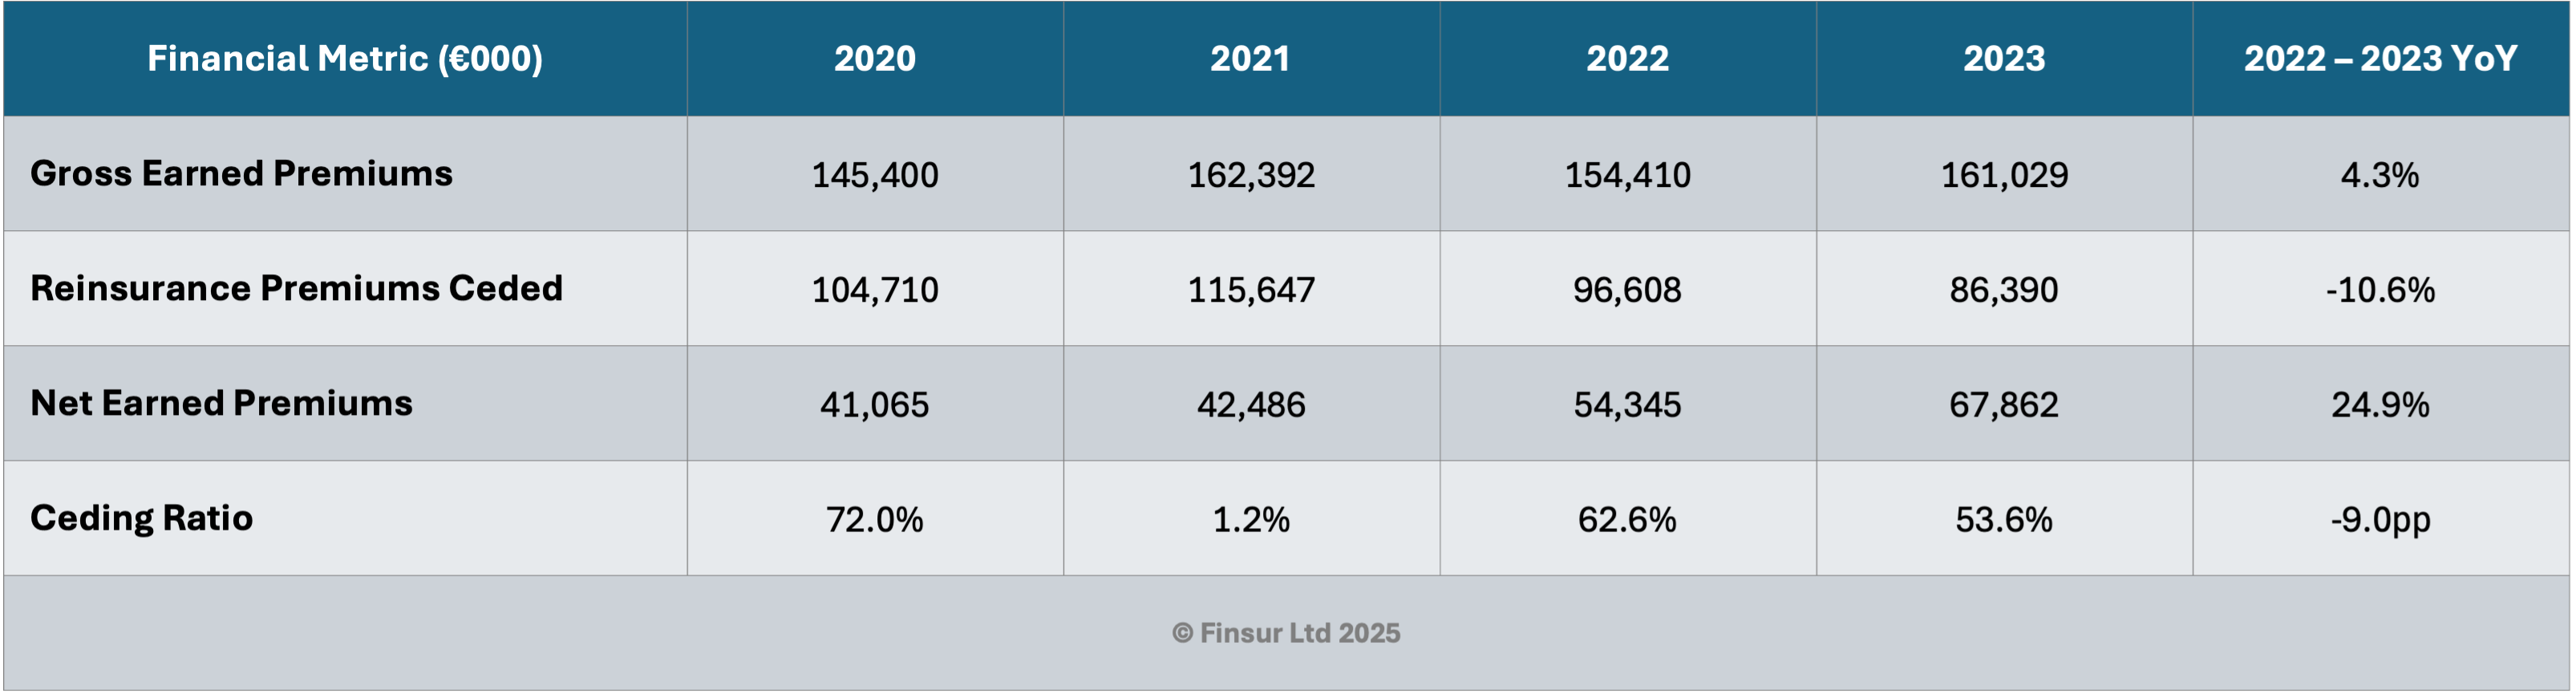
I’ve got a chart further down that expands on the premium analysis but in summary: UK mobile contributes ~64% of premiums; Germany mobile ~18% of premiums; Spain mobile ~12% and; the reinsurance accepted from Brasil is ~2%. Other non-mobile premiums make up the rest.
The reduction in premiums ceded to reinsurers could be down to a number of factors. First, the business might be becoming less attractive and rates consequently have hardened forcing Telefonica Insurance to assume more risk. Second, Telefonica’s confidence in predicting the risk may be improving over time and they are comfortable retaining more of it. It’s also likely that a combination of both factors mean management are having to adapt tactically and make the best possible decisions within the market constraints.
Claims Experience & Loss Ratios
I’m left a bit curious by Telefonica Insurance's claims experience over the analysis period. In the section above, I noted the switch from cash to accrual accounting. Now, due to the nature of the insurance policy and premium collection, I’d suggest this change would have increased premiums and claims by about 1/12 or 8.33%. In reality the premiums ticked up by 11.7%. But, the claims costs didn’t. Bear with me. If for a minute we assumed they would have done, i.e. moved from €65,442k to €70,896, when they actually came in at €56,766k we’ve got a 20% drop in claim expectations.
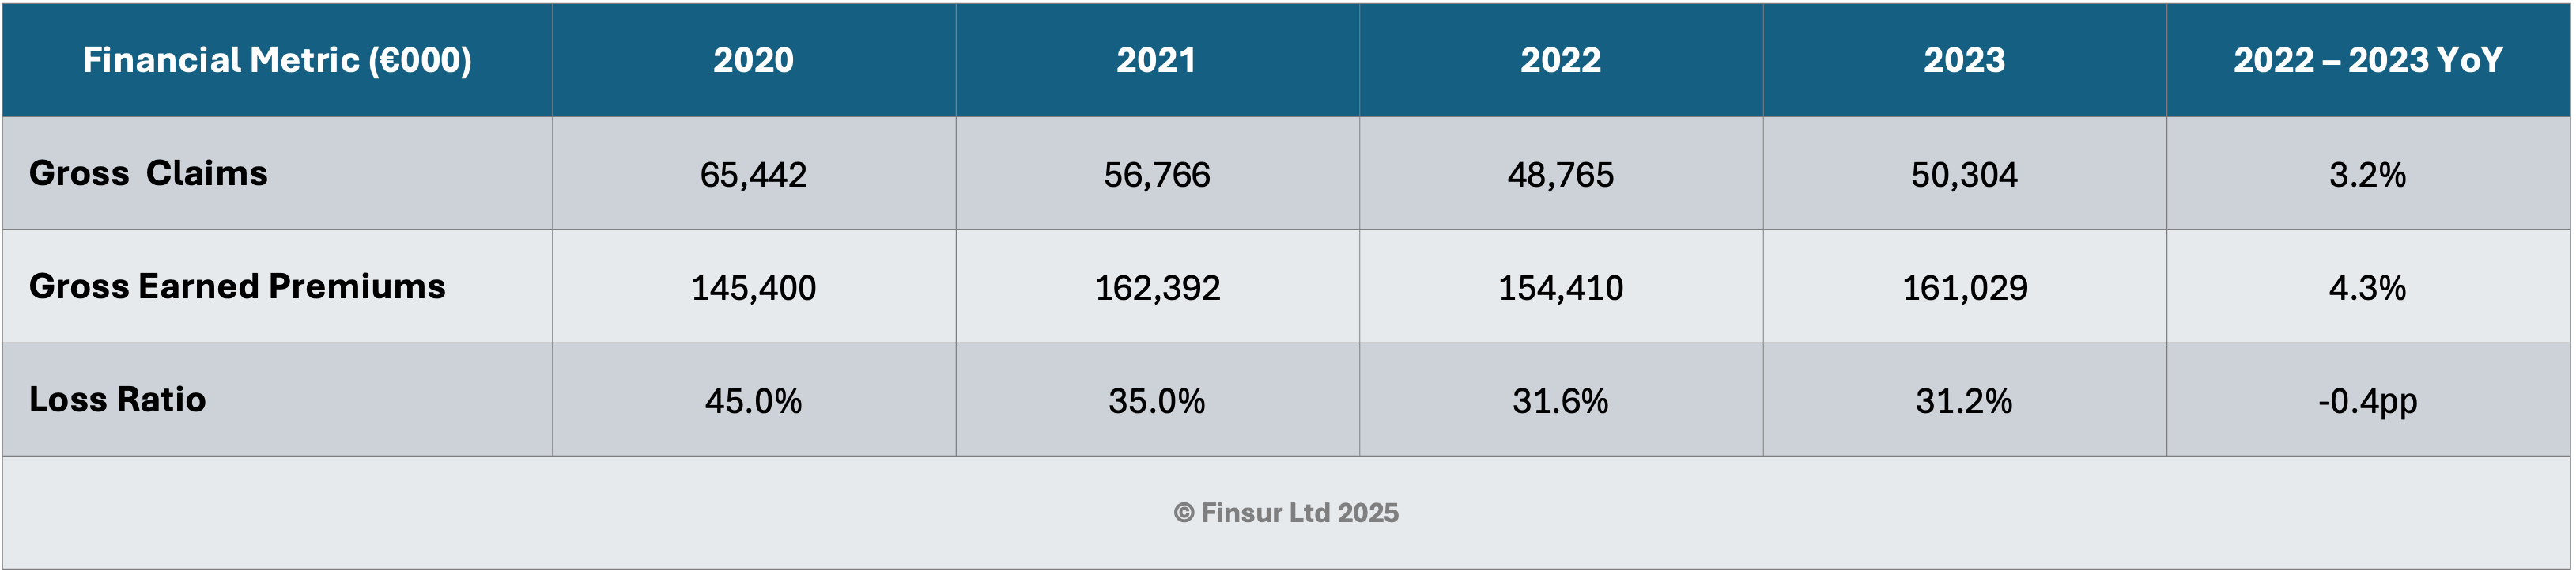
I’d never really given much thought to the depth of the COVID impact in these terms before. 2022 sees continued claim cost suppression and in 2023 I would have expected a quicker return to normality, especially with the pressure on secondhand and refurbished device prices. However, gross claims only increased by 3.2% from €48,765k to €50,304k.
So what’s going on. Well, I’m just going to jump to an assumption that behavioural changes, i.e. remote working were still having an impact in 2023. I’m also going to assume that when the 2024 accounts are filed, there’ll be a further return to normal and in 2025 when all the CEO’s with enormous property portfolios have had their rants and regrets1, claims costs will be riding high again.
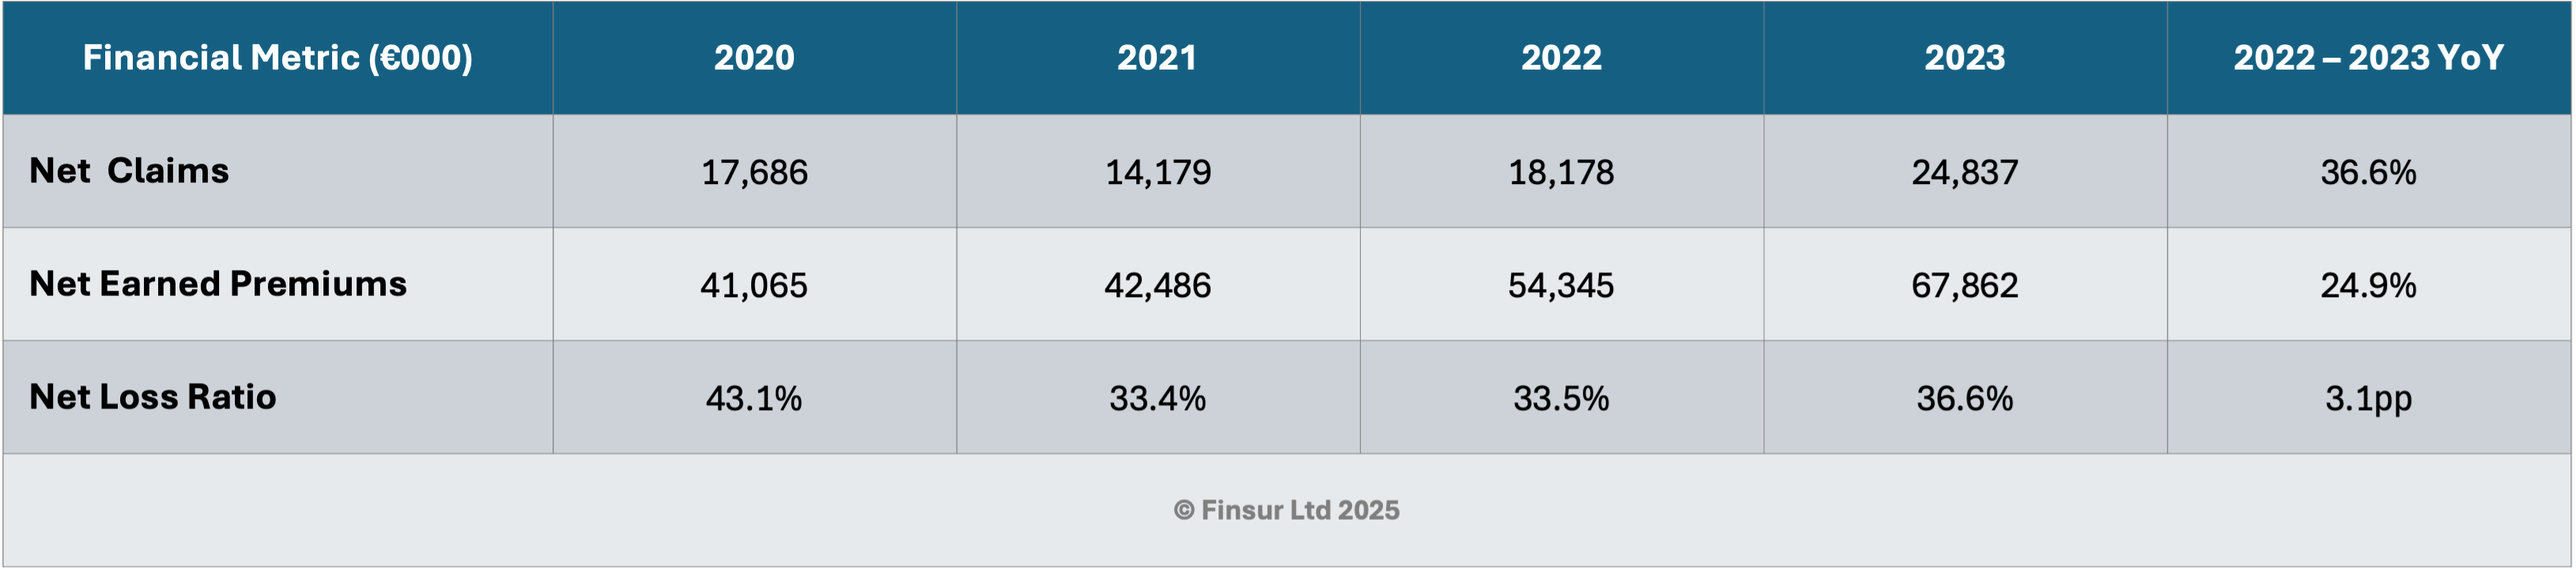
The more significant increase in the net loss ratio reflects the company's reduced reinsurance, resulting in retention of a larger portion of claims. The divergence between gross and net trends demonstrates the impact of the company's shifting reinsurance strategy tactics circumstance.
Acquisition Costs and Operating Expenses
Whilst the acquisition costs look high, it’s good to see that they have remained stable over the analysis period with slight variances around an average of 44%. I wouldn’t pay too much attention to this, other than noting it as a starting point for any future competitive tenders, although I continue to find outsourcing this unlikely whilst the group remains committed to the captive.
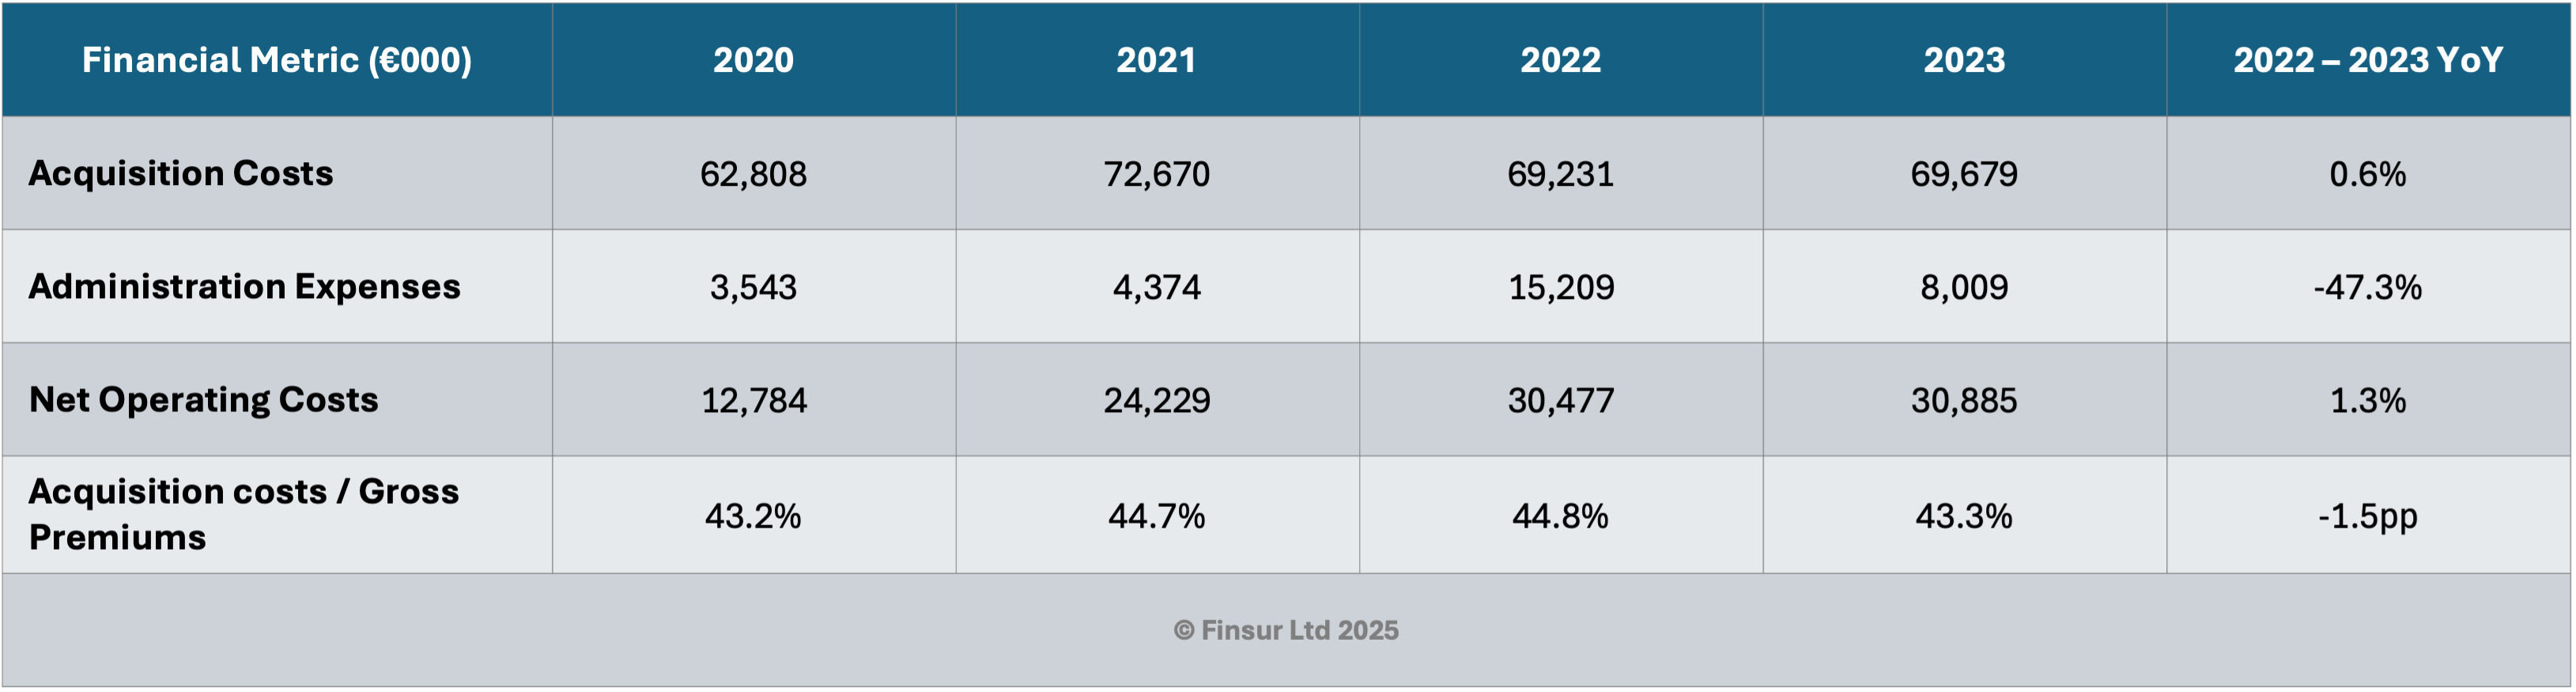
The Administration Expenses line is a little curious; there’s a spike in 2022 which appears mostly related to a one-off possibly stemming from an error in the calculation of the UK regulatory fees and levies resulting in a total underpayment of almost €3.8m between 2012 and 2021 to the FCA. Ouch.
I can imagine there were a few additional expenses flowing through from re-domiciling the HQ to Spain that have probably stabilised by 2023 as the expenses declined from 2022. Overall this should present an improved expense ratio, however, €9m of “Other Technical Costs” appeared in the Income Statement which are not, unfortunately, explained either in the accounts or the SFCR, unless of course it used to be part of the 2022 Administration Expenses and has now been reclassified.
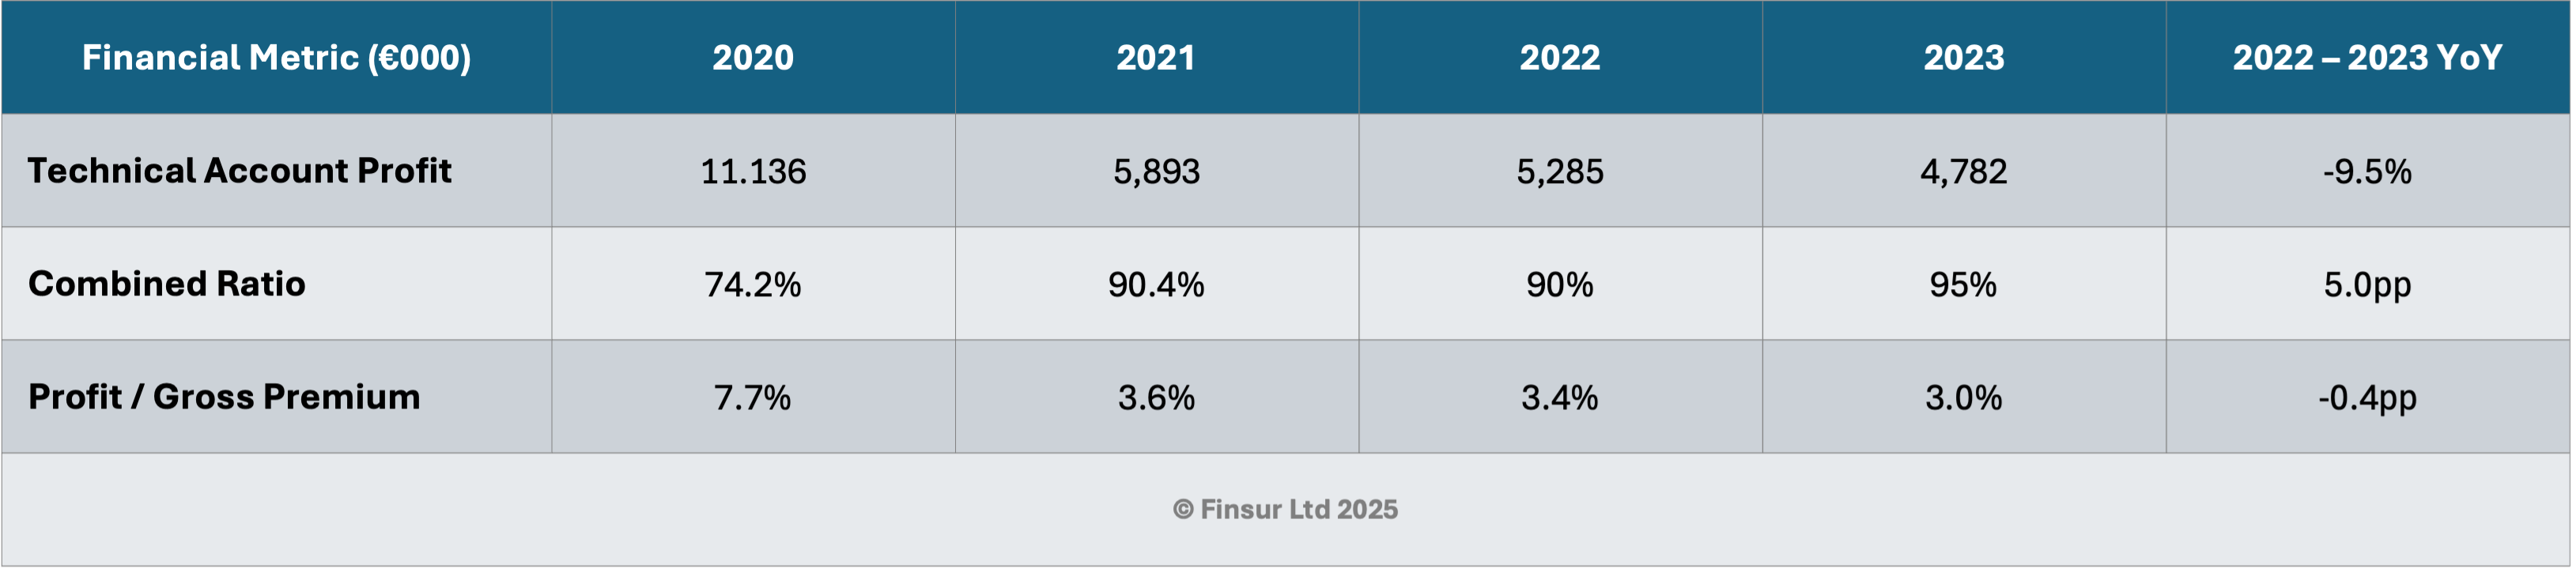
Profitability & Combined Ratio
Since 2020, profitability has declined by 57% and from 2022 to 2023, it’s down 9.5%. Generally, this is down to a combination of slightly higher claims costs, increased operating expenses, and less favourable reinsurance arrangements resulting in decreased reinsurance commissions.
Translating the numbers
Right, so what might all that nerdy shit above mean? By applying a bit of poetic license, and you can agree or disagree with my assumptions, (if you think I’m way off, please don’t hesitate to drop me a note, evidence/sources always appreciated) Let’s use the additional management information to work through the book.
The earned premium breakdown over the last three years has been provided and shows that in 2023, the UK contributed about 64% of premiums, Germany contributed 17.6% of premiums and Spain 12.3%. The ups and downs in Germany and Spain are notable, but I think I can put some of the variance down to the pandemic impact with Germany recovering far more quickly than Spain.
Using weighted average annual premium of €118 based on website pricing and the price banding of phones sold, I estimate the following policy counts for 2023:
UK: ~870k
DE: ~240k
ES: ~170k
Now, there are a couple of discrepancies to highlight. First the earned premium analysis and the total earned premiums for 2023 provided in the annual accounts don’t equal. However, it’s not material (δ0.4%) and it might be that it’s too small to bother listing in the breakdown, or there’s some other factor not listed. Second, the estimated total policy count (1,280,000) is somewhat short of the 1.6million policy holders stated in the SFCR. However, management may be including Brasil, which based on their usual reinsurance ratios could be around €6.1m in premiums and 52k policies. There’s also some policyholders in non-mobile insurance policies. Given that management stated 890k policies for the UK in 2019, 240k for Germany and 260k for Spain, I’m more comfortable with my estimates than the total stated in the SFCR.
Taking the assumptions a bit further, using an average primary use phase of 3.5years, a net new sales ASP for Apple of €946 and for Android €365, grabbing the annual device sales by market and adjusting for “value” versus “volume” market shares, it’s possible to estimate an attachment rate which shows a significant variance in either the buying behaviours of customers across the three markets or Telefonica’s selling practices:
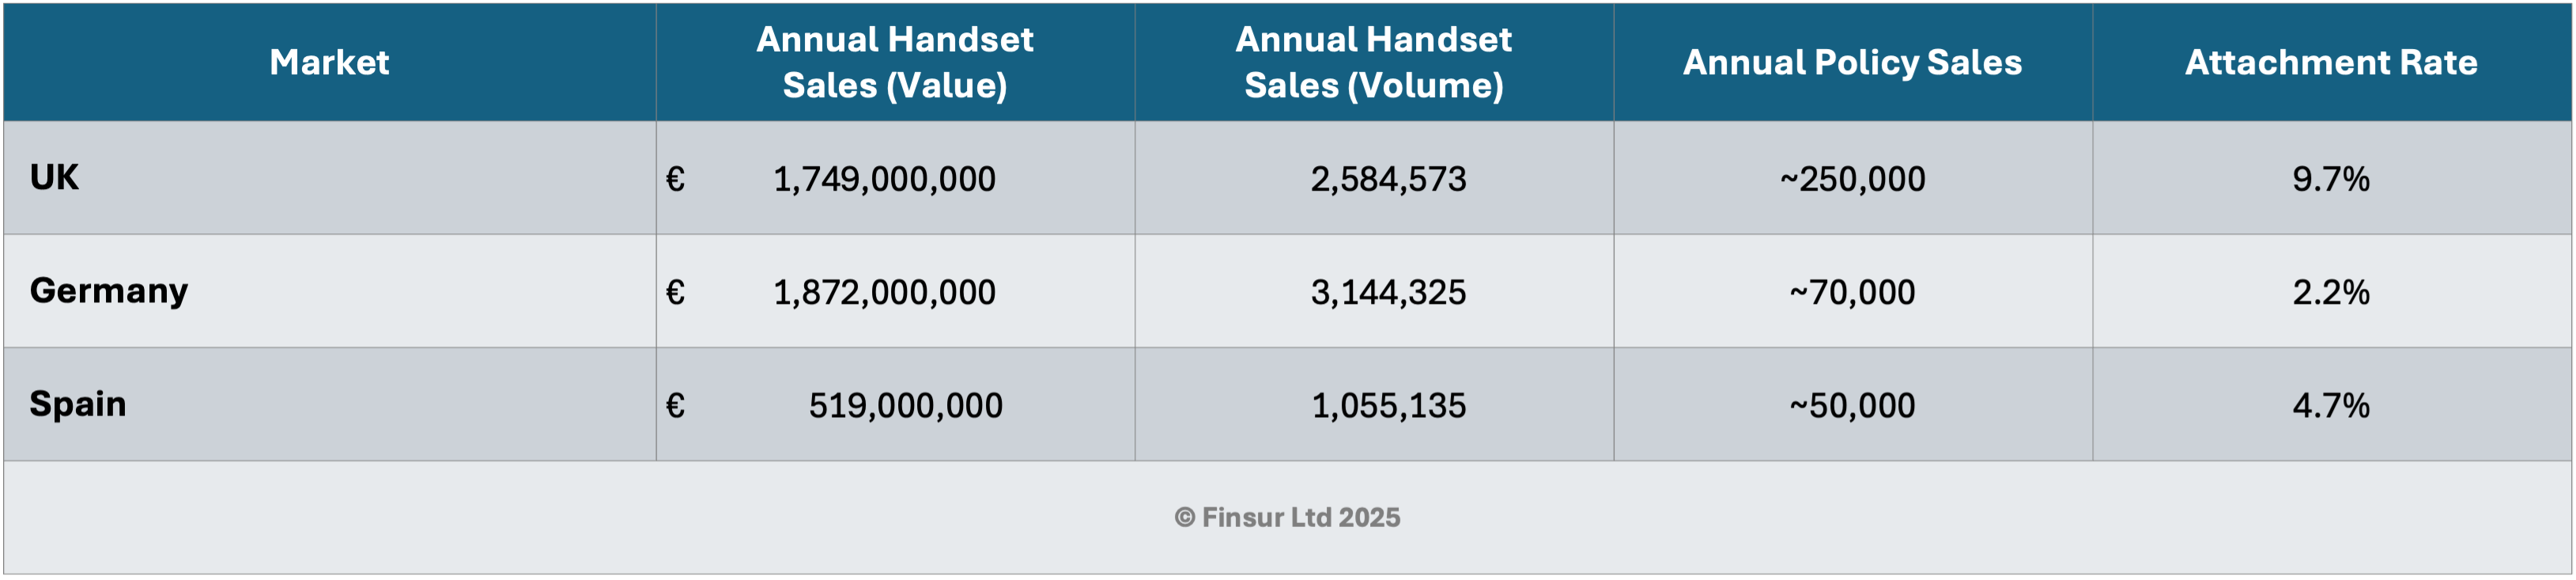
So, if you’re looking at any competing for any carrier insurance programmes across these three markets, you may want to consider the above attach rates to help with size estimates. Or you can always drop me a line of course.
In terms of claims, figuring out volumes is a bit more challenging because, unlike the premiums, I don’t have access to how much Telefonica Insurance might be paying their suppliers for repairs and replacements. So I have to make some (very likely) less accurate assumptions, which I am going to apply across the book:
Estimate Claim Frequencies:
Accidental Damage: 10%
Theft: 1%
Loss: 2%
Estimated Average Repair Costs:
iPhone: €250
Android: €200
Estimated Average Replacement Costs:
iPhone: €450
Android: €350
Device Mix:
iPhone: 42%
Android: 58%
With the portfolio of 1,280,000 policyholders…
For damage claims (128,000):
Repairs (98% success rate): 128,000 × 98% = 125,440 repairs
iPhone repairs: 125,440 × 42% = 52,685 repairs at €250 each = €13,171,200
Android repairs: 125,440 × 58% = 72,755 repairs at €200 each = €14,551,000
Replacements (2% failure rate): 128,000 × 2% = 2,560 replacements
iPhone replacements: 2,560 × 42% = 1,075 replacements at €450 each = €483,840
Android replacements: 2,560 × 58% = 1,485 replacements at €350 each = €519,680
For theft and loss claims (38,400) i.e. all replacements:
iPhone replacements: 38,400 × 42% = 16,128 at €450 each = €7,257,600
Android replacements: 38,400 × 58% = 22,272 at €350 each = €7,795,200
Total expected claim cost: €13,171,200 + €14,551,000 + €483,840 + €519,680 + €7,257,600 + €7,795,200 = €43,778,520
Total repairs: 125,440 devices
iPhone repairs: 52,685 devices
Android repairs: 72,755 devices
Total replacements: 40,960 devices
iPhone replacements: 17,203 devices (1,075 from failed repairs + 16,128 from theft/loss)
Android replacements: 23,757 devices (1,485 from failed repairs + 22,272 from theft/loss)
Total claims: 166,400 devices
The estimate €43.78M is just about close enough to the reported claims figure of €47.93M, with a difference of about €4.15M which could be accounted for by claim processing costs, logistics costs, inspection and quality validations costs, salvage value adjustments, variations in device costs and of course my assumptions might be out. However, until I can further refine the estimates, I think this gives a decent idea of volumes across the book.
Summary
From a management perspective, increasing the captive’s value within the group must be relatively challenging. In isolation, the total revenue is substantial and many third party insurers would willingly take this on, but when compared to an operating revenue (across the three markets covered) of €33.8bn, it probably doesn’t get much of a thought other than a bit of commission negotiation and customer expectation alignment.
There are a couple of areas that I can imagine will be in focus though. Despite the anecdotal evidence that mobile insurance is less valued in Europe than in English speaking markets, I’m sure everyone involved would love to find a way to increase attachment rates in Germany and Spain.
Developing products in collaboration with operating companies that focus on the circular economy, given Telefonica is a signatory of the GSMA pace setting targets2 for take-back schemes, widening the insurance net across more products could help improve the quality and value of phones traded-in. Any thoughts the operating companies might have on future value guarantees would likely need to include insurance as part of the proposition.
There’s evidence that management are trying to expand the product set with the latest accounts showing claims paid for “multi-risk home insurance” which according to the accounts filing began sales in 2022. I can’t recall seeing this offered, but this is a tough market in which to be competitive and I’ve got the opinion there’s not enough elasticity in the brand stretch for this to be successful. I’ve have spotted some involvement in an embedded insurance offer in partnership with ERGO for O2 Care and O2 Travel, but it’s unclear what particular part the captive is playing3.
Finally I’m aware that lots of carriers like their cash upfront but I think the optimum time to make a successful bid for the captive (e.g. Likewize / Optus4) has long gone. With the well documented supply limitations and increasing competition in device acquisition, claims costs are only going to go one way for the foreseeable future and cash generation will be suppressed. Still, there are probably some scale economies to be had and some administrative expense overlap so I suppose there’s an outside chance someone will come along and make an offer.
Peace,
sb.