


GSMA Pace Setting Targets
More tortoises than hares...

In November last year, I published some analysis of the UK Mobile Trade-In market and identified that one of the key drivers of growth would be increased carrier participation1. This will be, in part, due to some of those carriers aligning their ESG reporting, and specifically their trade-in activity with the GSMA’s pace-setting targets2 which are designed to “accelerate and build upon the work already being undertaken by the mobile industry as it takes steps to move away from the traditional ‘take-make-dispose’ approach to the materials used in mobile phones”.
The initial cohort of carriers consisted of BT Group, Globe Telecom, GO Malta, Iliad, KDDI, NOS, Orange, Proximus, Safaricom, Singtel, Tele2 and Telefonica who, were joined soon after, by Deutsche Telekom, NTT Docomo, SoftBank and Telenor,3 bringing the total to 16 participants.
There are two specific targets metrics that may interest anyone involved in the secondary phone market and especially those seeking to support carriers to develop and refine their trade-in programmes:
Increase take-back of mobile phones:
By 2030, the number of used mobile devices collected through operator take-back schemes amounts to at least 20% of the number of new mobile devices distributed directly to customers.Boost recovery of mobiles and prevent devices going to landfill or incineration":
By 2030, 100% of used mobile devices collected through operator take-back schemes will be repaired, reused or transferred to controlled recycling organisations.
Whilst relatively unambiguous, there has been some interpretation of the definitions which means, you’ve guessed it, consistent reporting isn’t possible across the group. Typically, just after I started this exercise, the GSMA released an update to the targets which provides more detail for some of the definitions4. The update also states there are 29 carriers in the project group. So once I find out who the other 13 are, I’ll add them to this study.
In addition to these two targets, carriers are setting targets for customer premises equipment (CPE) take-back and, in some instances, publishing additional metrics that disclose more granular data, always welcome, but again, inconsistent.
The purpose of this exercise is to set out the data from each of the participating carriers in one place and identify the gaps or, depending on your perspective, the opportunity. Full disclosure as always, interpretation of the GSMA targets is inconsistent and assumptions are required in a number of cases. These are explained for each carrier as necessary. Participating carriers in alphabetical order:
Thankfully, BT’s data is well-aligned with the GSMA targets and requires little interpretation. I’ve worked back from the collected devices and take-back rate provided to produce an estimate of the distributed devices and then calculate a “Gap” number. Data is FY2024.
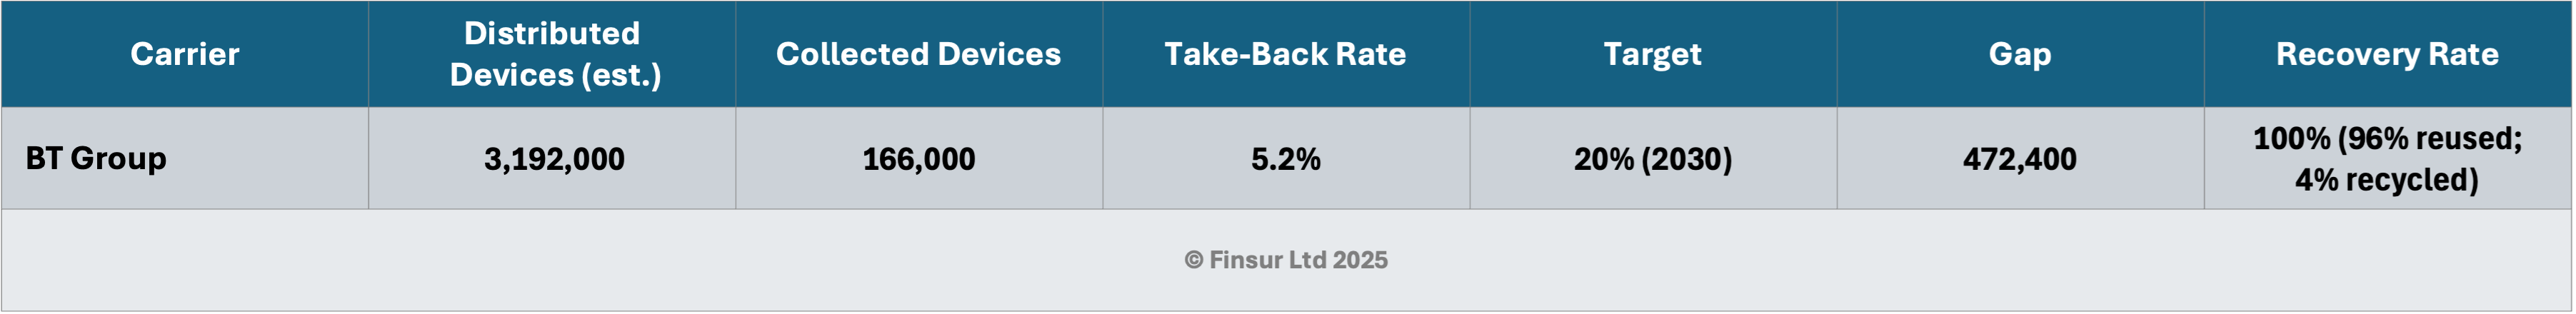
Device distribution estimate calculated from take-back rate and collected volume.
BT need to collect an additional 472,400 devices annually to reach the 2030 target based on current distribution volumes.
Already achieved the 100% recovery rate target with all collected devices being either reused or recycled.
The EE Trade-In service has collected over 1 million devices since its launch in 2023.
BT’s customer premises equipment (CPE) take-back rate of 67% (with a target of 75%) is significantly higher than the FY 2024 mobile device take-back rate of 5.2%. Whilst this is to be expected, CPE is typically leased rather than sold, it demonstrates BT’s more mature circular processes for these devices.
DT7
Deutsche Telekom’s data is a little more complicated to process due to its scope of operating companies and the variability in data capture across them all. They also appear to go out of their way to avoid stating any equipment revenues or unit sales in their financial reports, which makes validating handset sales difficult. Fortunately, and to their credit, they’ve got a decent 2023 CSR reporting tool which is a little more transparent. Data is FY2023.
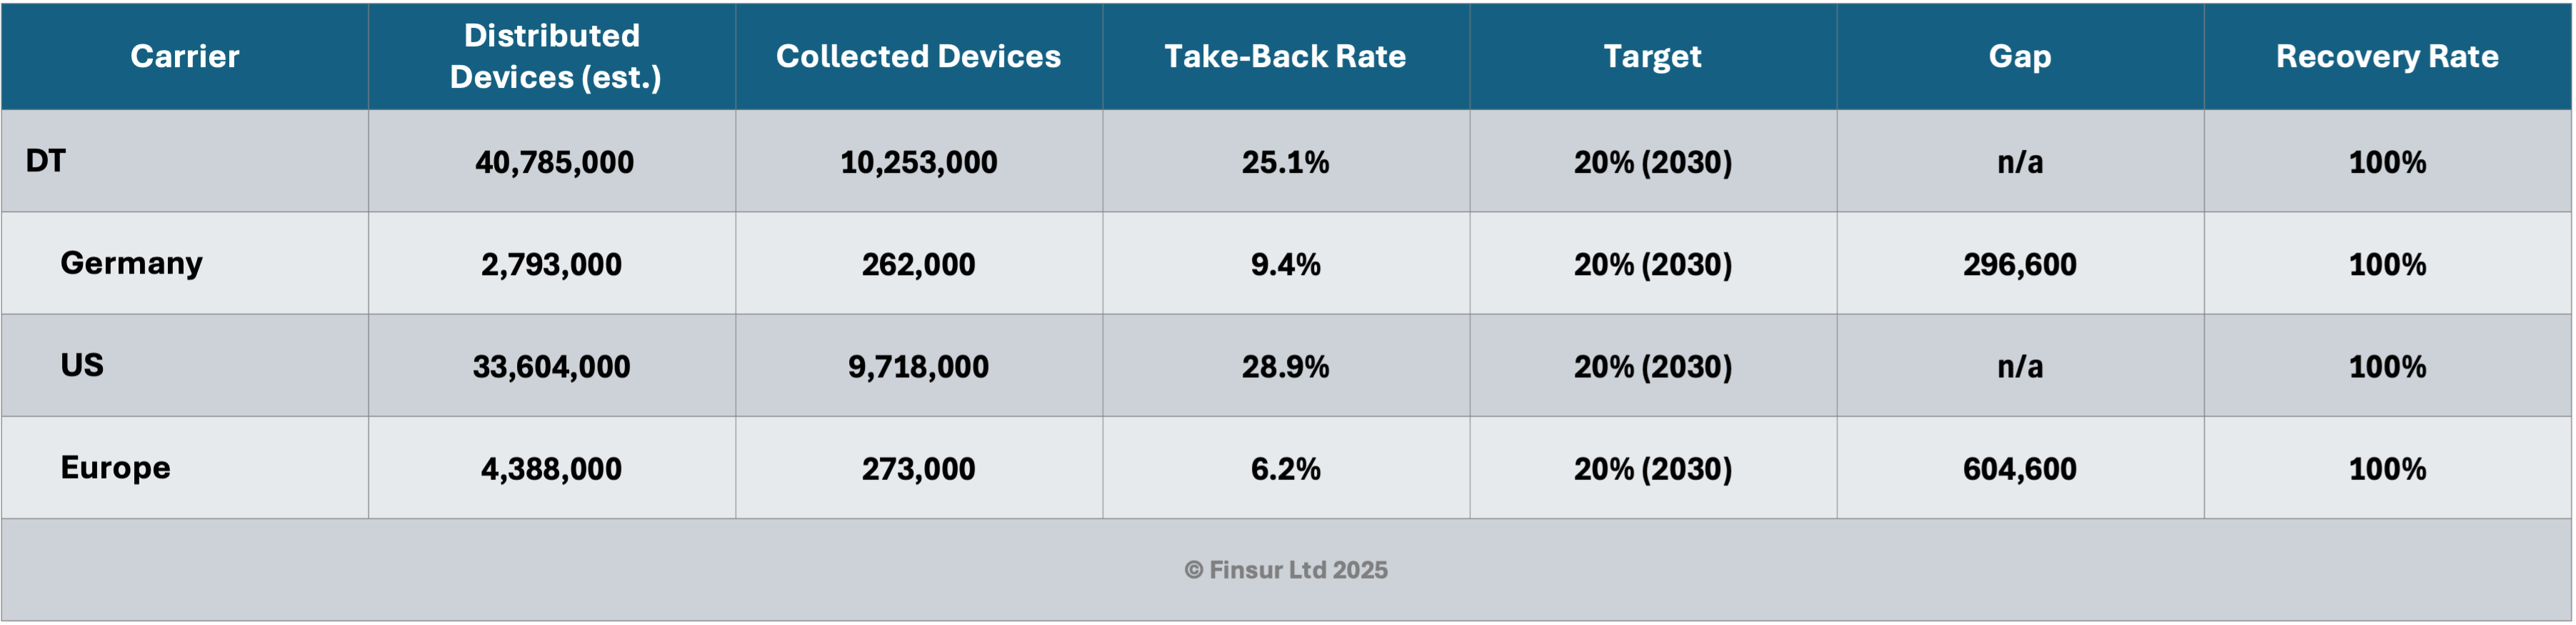
Data for the U.S. is not explicitly stated and is calculated by subtracting Germany and Europe data from Group data.
U.S. take-back rate is propping up the group, being far in excess of the other business units.
Considering Germany and Europe only, DT need to collect an additional 901,200 devices annually to reach the 2030 target based on current distribution volumes. This represents significant volume.
DT report that the 100% recovery rate target for all collected devices being either reused or recycled was achieved in 2022.
Regarding CPE take back. It feels like there’s more work to do on reporting, but DT state that: “In 2023, more than 4 million CPE items were collected across the Group, and 36 percent of that quantity were refurbished.”.
I’m not picking on DT here at all, their US take back rate is high, but it does make me question the point at which a carrier can claim to have met the target whether at group or operating company level. I missed that being explicitly stated.
Globe Telecom8
On their website, Globe Telecom state that 2023 was “A year of adopting circular practices”, so I was expecting little and got even less. According to their 2023 Integrated Report the GSMA targets have: “No available data but will collect within the next three years.” On the upside, it appears that Globe will be publishing the refurbished mobile devices distributed to customers as a percentage of overall sales. That’s useful, it’s a good metric. Data was FY2023.
Go (Malta)9
For those unfamiliar, Go is the second largest carrier in Malta. They also have operations in Cyprus. Other than reporting 56,732 units, euros or tonnes of equipment refurbished to be reused, there is no other reference that I can find to the GSMA targets, at least in the 2023 information. Perhaps 2024 data will offer more detail. Data was FY2023.
Iliad10
So far as I can tell, whilst acknowledging sign up to the GSMA targets, the associated performance data has not been published yet. However, Iliad did state that 6% of phones sold in 2023 were refurbished, down from 8.8% in 2022.
Iliad also confirmed their partnership agreement with Certideal to provide existing and new Free subscribers discounts of up to 10% on refurbished devices. Data was FY2023. By the way, Certideal is a brand of VC Technology, who, I’m certain regular readers would like to know, began to file a Certificate of Non-Deposit, in lieu of public accounts in 2022.
Being Japan’s second largest operator with approximately 32.3million smartphone subscriptions you’d expect some decent numbers from KDDI. Unfortunately the published data doesn’t yet align with the targets, so I’ve had to make some assumptions. Regardless, it’s likely they’re achieving them. Data is FY2024.
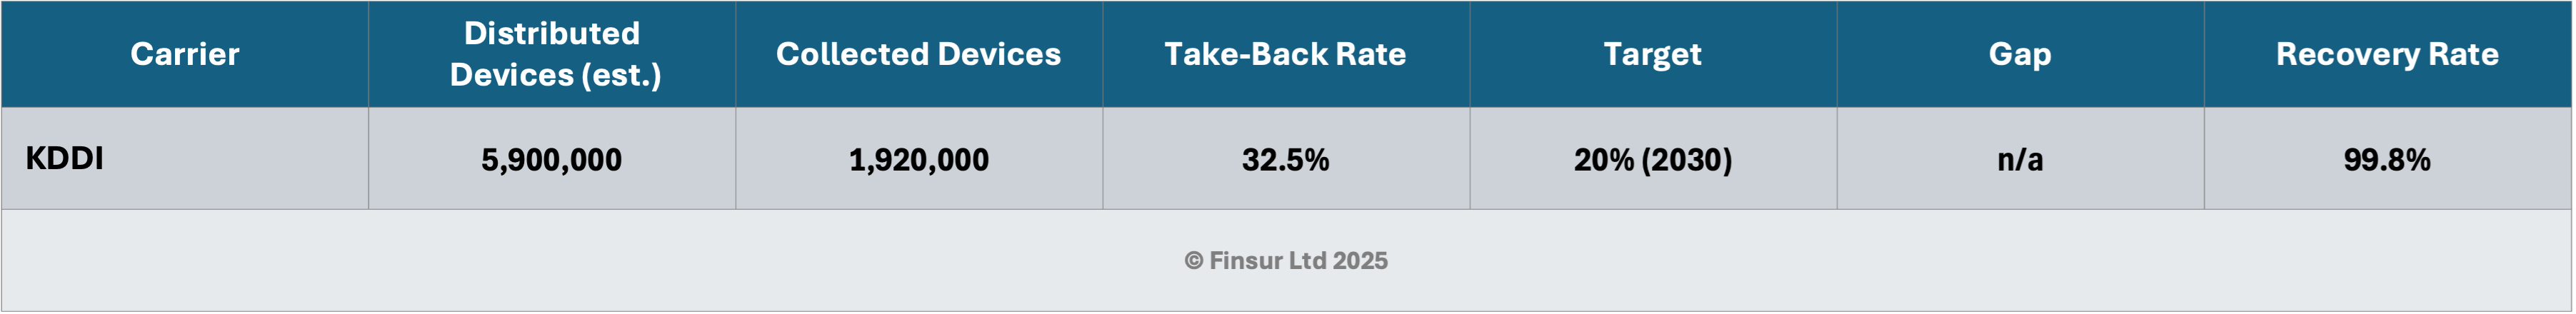
Distributed device estimate is calculated from handset sales value and a weighted average unit price of ¥120,800.
The definition of collected devices is “Number of mobile phones and other devices collected (mobile phone main body, batteries, chargers)” so it’s possible that the take-back rate as calculated is overstated with regard to the explicit GSMA target.
One item that I noted was that KDDI’s stated target regarding the Recovery Rate is “Maintaining material recycling ratio of 99.8% for used mobile phones”. Depending on volumes, this is different to the 100% demanded by the GSMA target. I’m wondering if this is simply an issue of timing in relation to reporting or an acknowledgement that perhaps the 100% target is not practically possible?
NOS13
Whilst circularity has been on Portugal’s largest carrier’s agenda since 202114, getting to the bottom of the data isn’t straightforward. Management had already identified mobile take-back as an area with more work to do and are clear to state in the chunky 2024 Integrated Annual Report that: “In 2025, with the full implementation of new trade-in circuits, we expect a significant increase in mobile equipment take-back and recovery levels, which remain very low”. Which is probably why getting any data this year is a bit of a challenge. Data is FY2024.
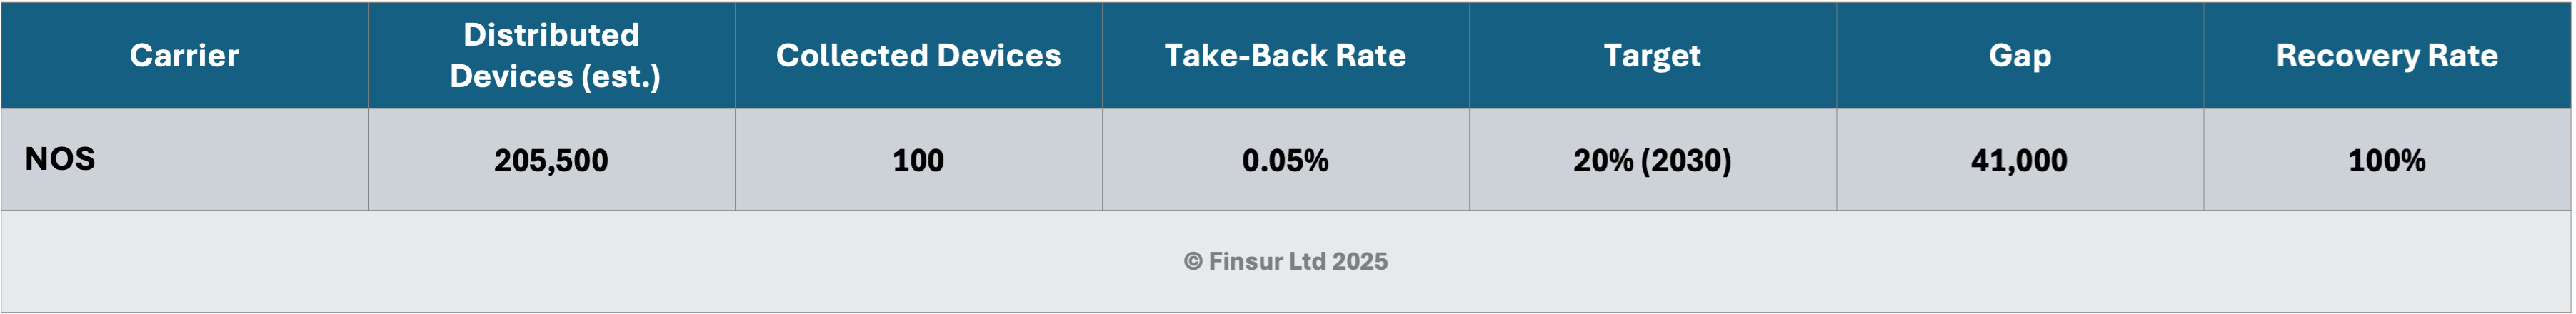
2024 Device Sales were approximately €115m which at a weighted average for a 30% iPhone, 70% Android market of €563 is about 205,500 units.
Collected devices are then calculated by using the 0.05% take-back rate given by the carrier.
I’m interpreting “All returned devices are refurbished and reused, or, when technically unviable, sent for recycling.” as a 100% Recovery Rate.
NOS data on CPE is a bit clearer with 53% of installed set-top boxes and routers being refurbished devices.
Despite FY2024 data being available. The current take-back data in the 2024 Environmental Responsibility section of the Group Sustainability Report is FY2023. So calculations are all based on FY2023 data. If I’ve got it right, NTT Docomo appear to be smashing the targets and, along with the other Japanese carriers, setting a high bar for the rest of the industry.
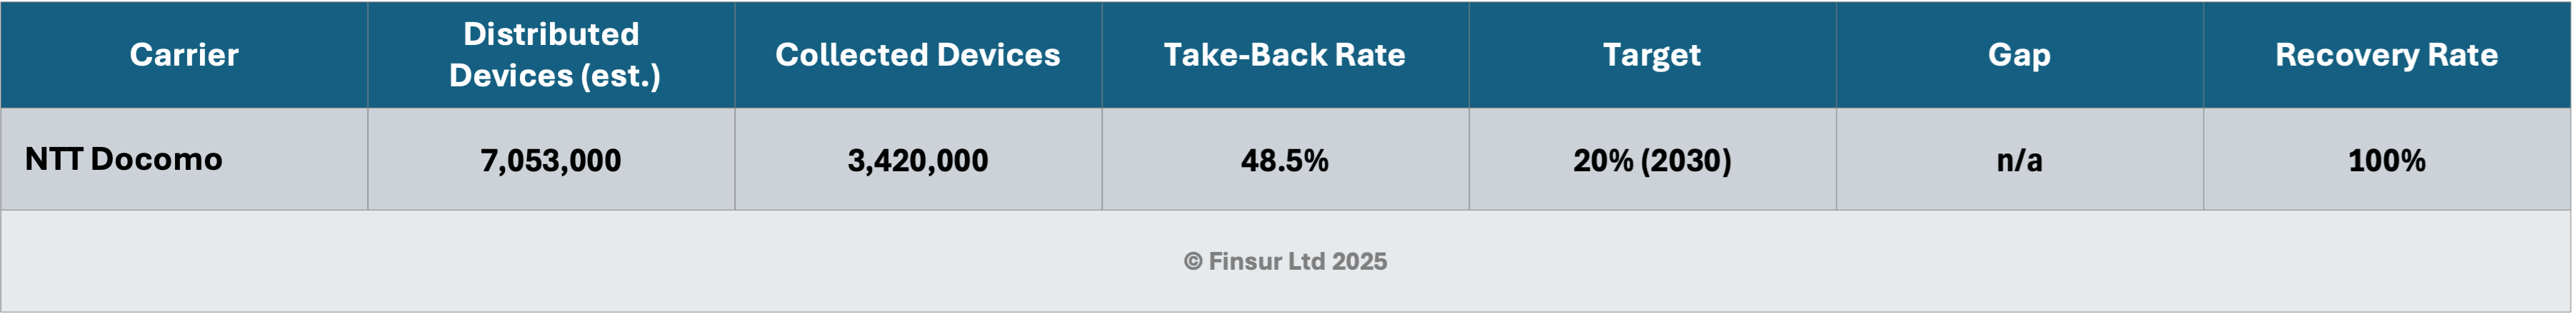
Distributed device estimate is calculated from handset sales value and a weighted average unit price of ¥120,800.
In addition to the 3.42m mobile phones collected, NTT state that just over 2m batteries were collected and over 0.5m chargers. They also provide data for the principle resources (copper, gold, silver and palladium) that have been recycled.
Docomo have been collecting and recycling phones since 2001 and since then have gathered a cumulative total of almost 128m devices.
Now, I admit to limited knowledge of the Japanese market in this regard. From what I can tell, in 2001 the Mobile Recycle Network was set up through the Telecommunications Carriers Association which collects devices in stores, from any carrier. They’ve published data since inception and the following chart is interesting in highlighting the decline in unit collection rates over time:
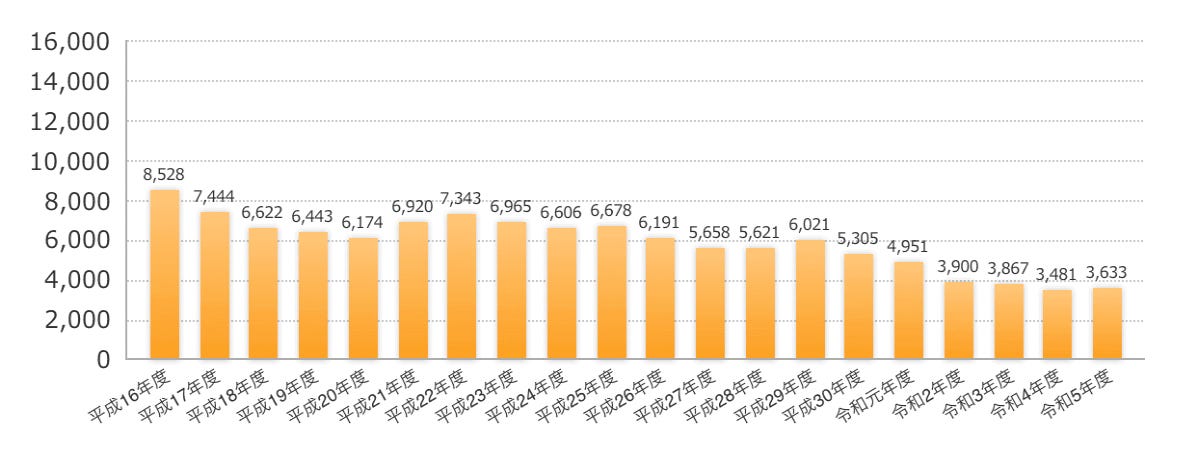
The first bar is FY2004 and the last bar is FY2023. Couple of things to note, If Docomo collected 3.42m devices, that’s 94% of the total devices collected. That doesn’t seem right for an organisation covering KDDI, Softbank and Rakuten. So, use this data with caution and if you have more information on how this works, please feel free to ping me.
Regarding the declining trend, I’m assuming there’s a period of (n) years in which consumers are handing in the “drawer phones” before take-back normalises in line with the upgrade cycle. I’m also not sure how this process works with respect to any trade-in and upgrade offers by the carriers. Again, if you know, please help me out.
Orange’s ESG / CSR credentials, at least in this area appear to be fairly solid. Not only are they aiming to surpass the GSMA target for mobile-phone take back in both quantity and timeframe, they are bringing phones back for processing in France from their operators in Africa where they don’t have access to suitable recycling facilities. This sounds like something to champion and an anecdote to some questionable historic practices19.
I couldn’t find the specific GSMA target data, so again I’ve had to make a few assumptions. Orange state that their current take-back rate, excluding devices brought back from Africa is 18.8%, including these devices, its 25.4%. Data is FY2023 inline with the latest CSR reporting.
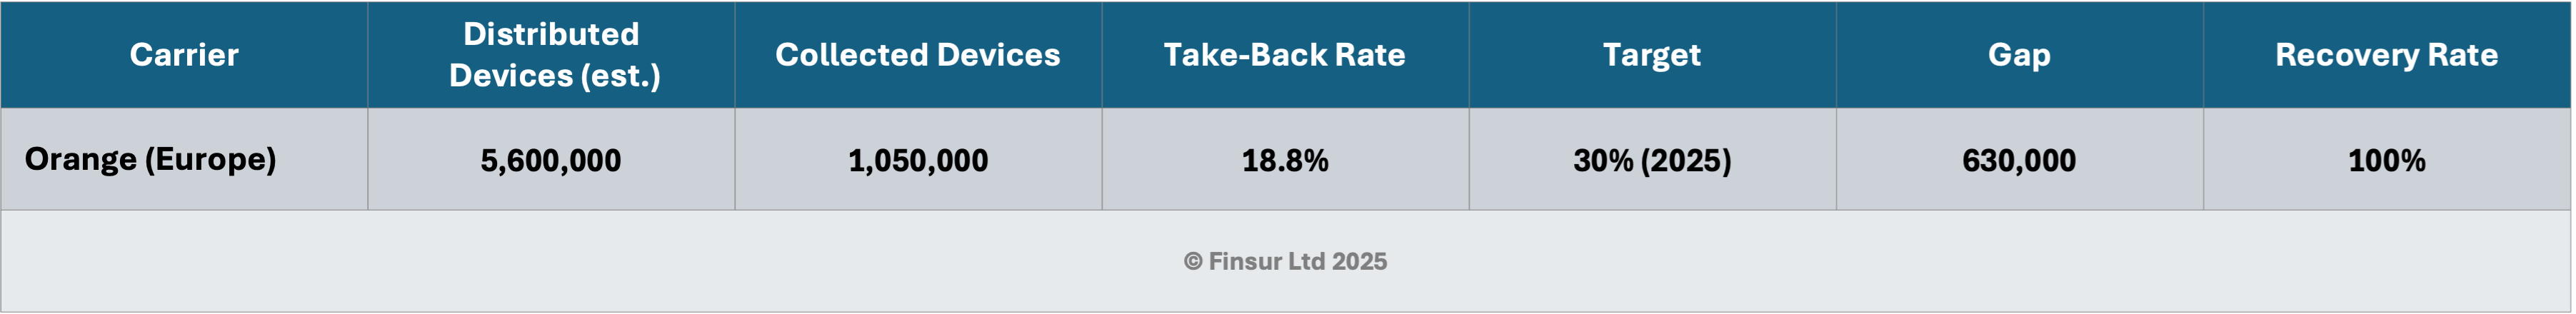
2023 equipment sales for Europe were approximately €3,151m which at a weighted average for a 40% iPhone, 60% Android markets of €624 is about 5.6m units. This is probably overstated, given that equipment sales will include mobile and fixed equipment. However, I’m making the assumption the majority of sales are mobile.
Collected devices are then calculated by using the 18.8% take-back rate given by the carrier.
In addition to the substantial mobile collections, Orange report that 3.8m items of fixed customer equipment were collected in 2023.
Good to see Orange also reporting that 2.9% of smartphone sales in Europe were from refurbished stock.
Finally, Orange are promoting repair services for mobiles and are providing some clear guidance as it relates to their repairer partnerships: “The attractiveness of these services is assessed by Orange according to five criteria:
availability of the service in the various distribution channels,
the independence given to the customer to carry out a diagnosis,
the predictability of the process
the visibility on the progress of the process
the continuity of service with the loan of a mobile during the repair.
A repair service is deemed attractive if its assessment exceeds an average score of 75%. The attractiveness of repair services improved in 2023 compared to 2022 in Belgium, Luxembourg, Moldova, and Poland. As in 2021, France and Spain are the two countries that have reached the 75% threshold”.
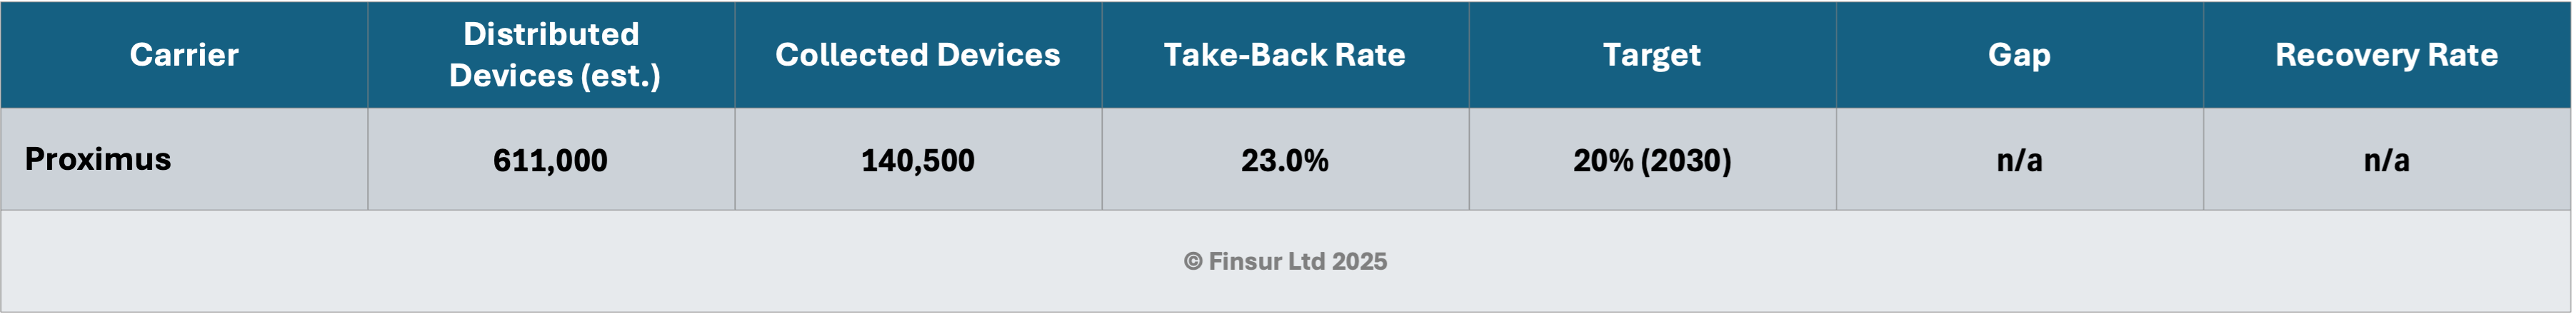
Proximus20
Proximus is the largest carrier in Belgium with approximately 5m subscribers. Based on their FY2024 Factbook, their circular economy data for fixed line equipment is more advanced than it is for mobile. That said, they state the mobile devices collected and the percentage of devices collected versus devices distributed. It reads like there is more work to do on the Recovery Rate to bring it line with the excellent data for fixed-line equipment. Based on the data, Proximus are ahead of the mobile take-back rate target.
Safaricom21
It’s possible that Safaricom are including some of the GSMA targets in broader e-waste data. I was unable to find the specific GSMA targets, other than a reference to 12,517 mobile devices repaired through retail outlets and tech partners.
Singtel’s mobile circularity targets are completely aligned with the GSMA definitions and usefully, they separate the Singtel and Optus operating company information. Whilst a comparison across the two units is not especially useful, it suggests that some intergroup knowledge sharing could be beneficial. Data is FY2024.
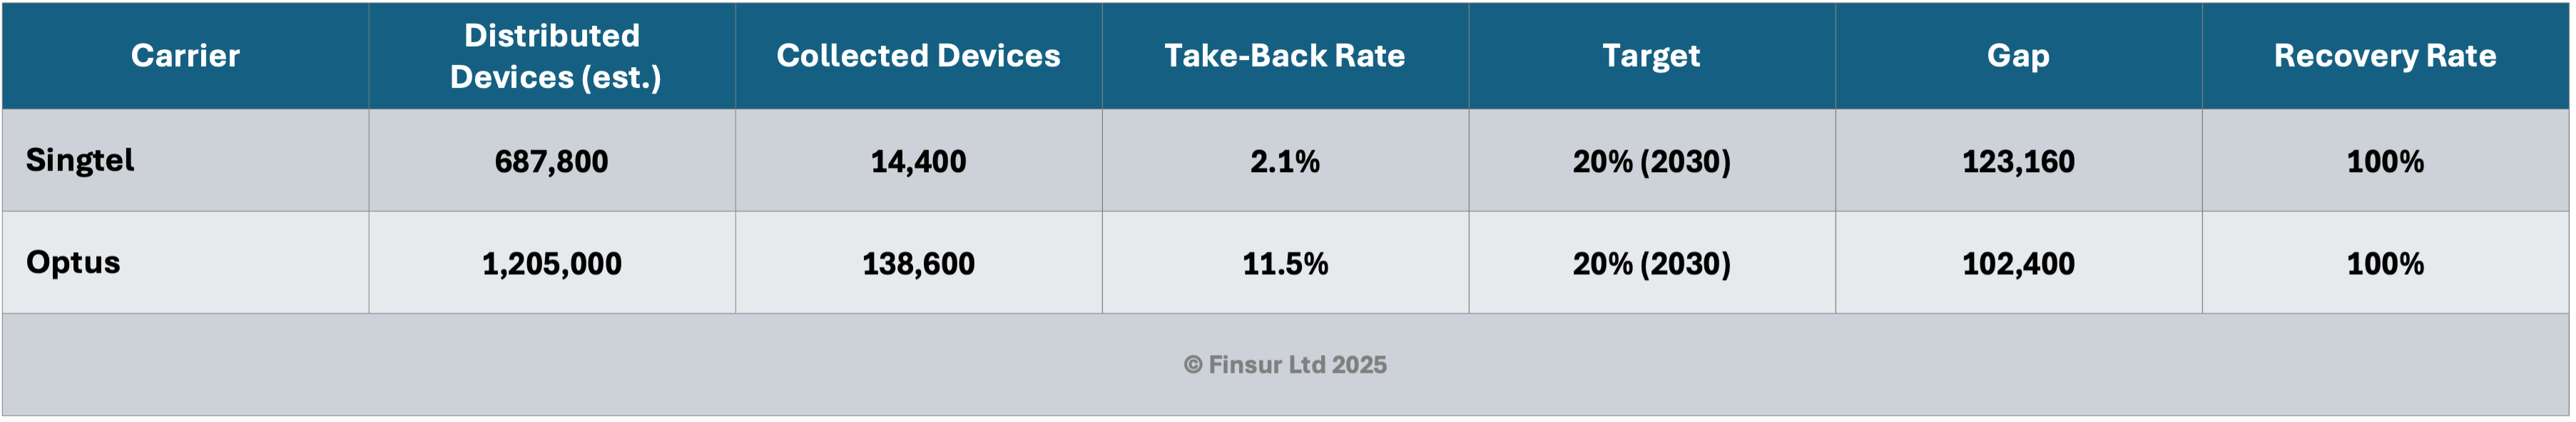
2024 equipment sales for Singtel were approximately SGD 564m which at a weighted average for a 30% iPhone, 70% Android market of SGD 820 is about 688k units. Again, this is probably overstated due to the definition of equipment including non-mobile devices.
2024 equipment sales for Optus were approximately AUD 1,482m which at a weighted average for a 55% iPhone, 45% Android market of AUD 1230 is about 1,205k units. Overstatement caveat applies.
Collected devices are then calculated by using the 2.1% and 11.5% take-back rates given by the carrier.
According to their sustainability report, it looks like future updates will also include metrics relating to the sale of refurbished devices versus total device sales. Good.
As a participating member of the MRN (along with KDDI and NTT), collection and recycling processes for Softbank are mature and according to published data, way in excess of the 20% GSMA target they’ve signed up for. Data is FY2024.
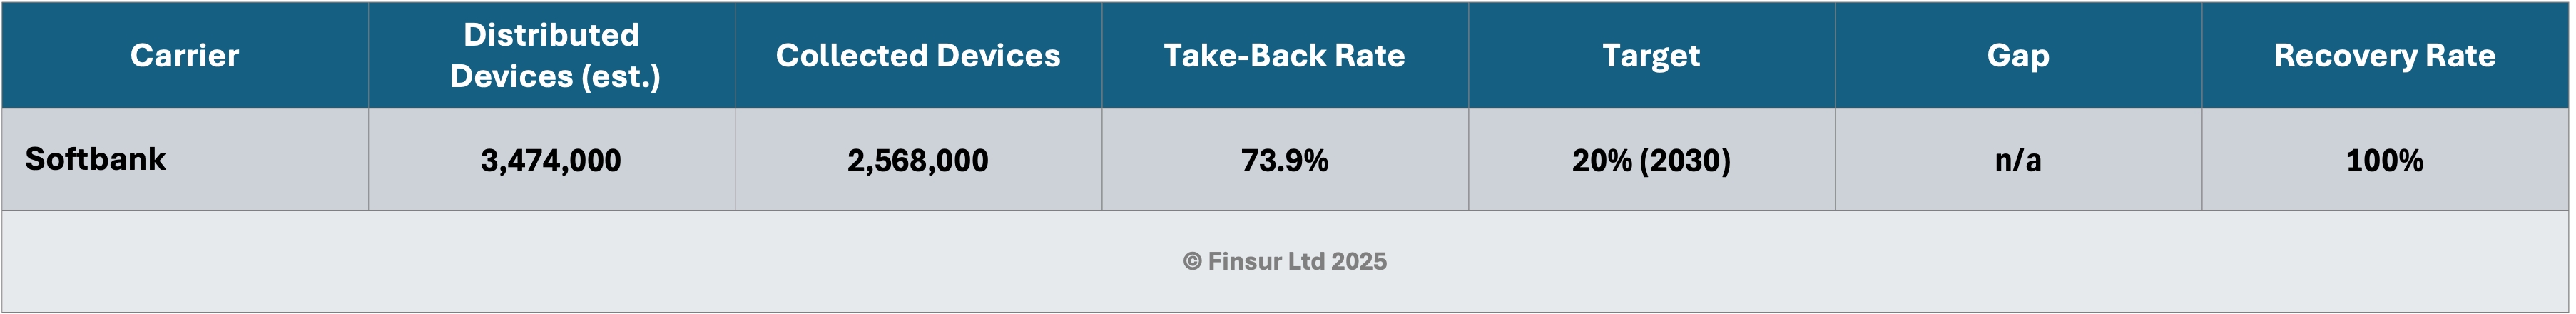
Distributed device estimate is calculated from handset sales value and a weighted average unit price of ¥120,800.
Adding up the collected devices of all three major carriers in Japan gives a number far in excess of what the MRN report. Maybe the report is in tonnes? Although my google translate didn’t spot it.
Tele226
Tele2 operate in Sweden, Lithuania, Latvia and Estonia. Mobile collection data as presented in their FY2023 integrated report is for Sweden only. Perhaps the 2024 version will cover all national operating companies.
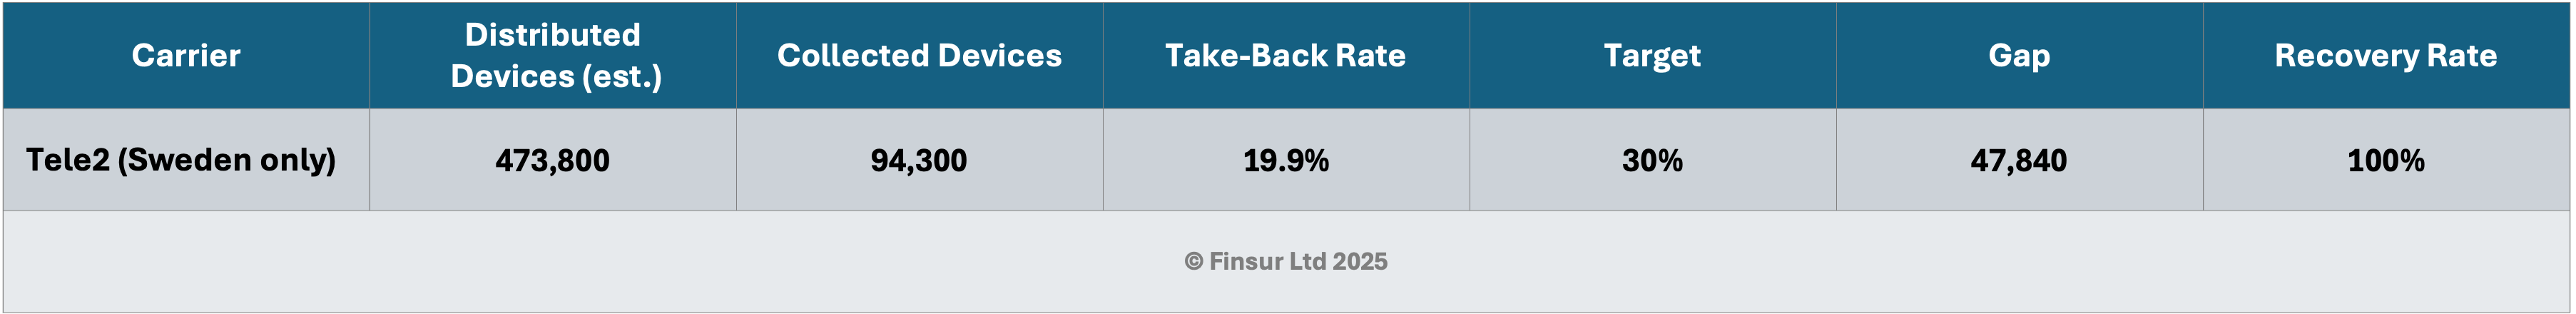
2023 equipment sales in Sweden were approximately SEK 2,057m for consumer and SEK 1,774 for business, both of which are included in the take-back metrics provided. At a weighted average for a 58% iPhone, 42% Android market of SEK 8,080 is about 473,800 units. Overstatement caveat re fixed equipment applies.
There is an additional metric that I didn’t quite understand which was “% mobile phones sold in a circular business model” of 28% increasing from 24% in 2022. I am unsure if this is a percentage of refurbished devices sold versus total devices, if it relates to Sweden only or the wider group of companies.
I found this paragraph interesting: “Tele2 has remained a project manager for the
GSMA project on circular economy for devices. The project has developed a circularity target to take back at least 30% of distributed mobile phones by 2030 that Tele2 and 11 other telcos from Europe, Africa and Asia committed to.”
I double-checked the GSMA target and it’s definitely 20%, although it does say “at least”.
Telefonica27
Telefonica’s targets are aligned with the GSMA definitions. However, whilst management state the commitments (are voluntary and) apply to all countries in which they operate, there’s no indication at what level the published metrics apply, i.e. group or operating company or whether the metrics include the VMO2 joint venture in the UK which would have a significant impact on volumes. I’m assuming not.
I’m not quite sure if Telefonica’s disclosures are improving or regressing. Last year it was disclosed that the take-back rate was 11% based on 102 tonnes of devices collected. For FY2024 we don’t get a take back rate, but we get told that 437,180 devices were reused from a 2030 target of 500,000 devices. So, you’ll have to view the data in this table with all that in mind.
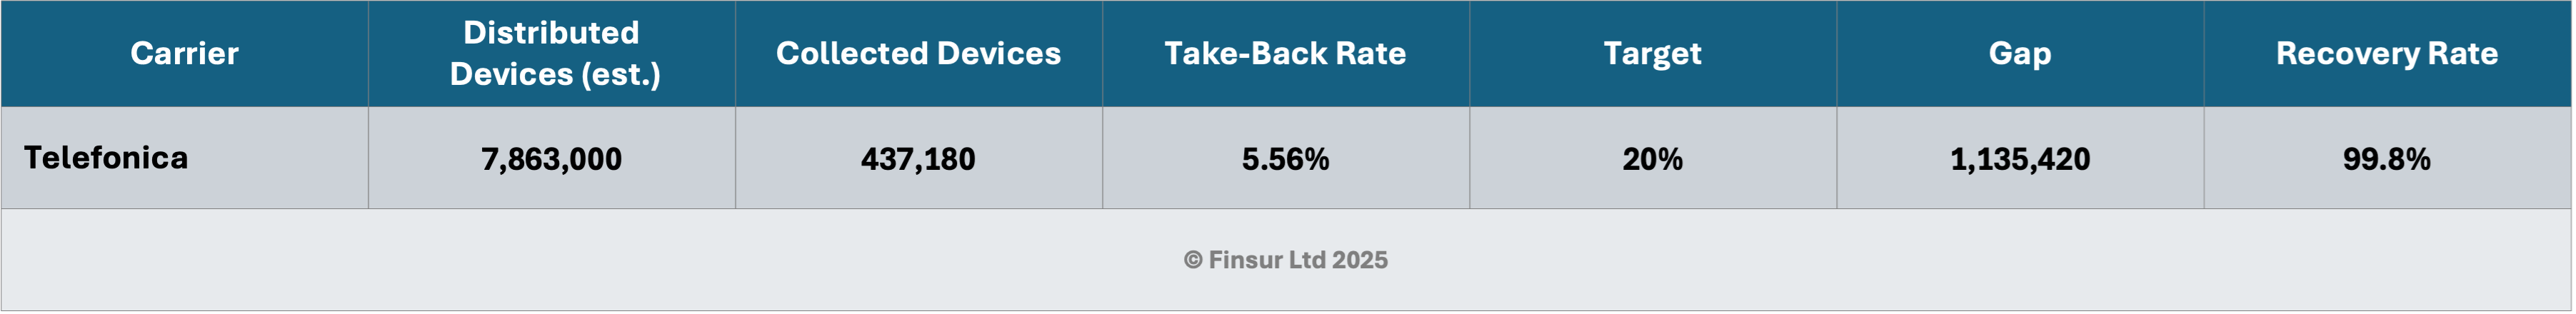
2024 handset sales in Spain, Brazil, Germany and Hispam were approximately €4,187m. At a weighted average for a 25% iPhone, 75% Android market of €533 is about 7,863,000 units. Remember, I’m excluding the VMO2 joint venture.
As stated in the 2024 Integrated Report there were 437,180 collected devices. However, this gives us take-back rate of 5.56% which is almost half of the data point given last year. This doesn’t really make sense.
It’s a big if, but these numbers suggest that across the markets included, there’s a gap of over 1.1m devices.
If were to use 11% on the 7.8m devices, the Collected Units should be around 865k with a gap of 427,750.
It’s hard to calculate the iPhone / Android share across so many markets, so it’s possible that’s throwing the data out.
Telenor28
Telenor operate in Norway, Sweden, Finland and Denmark, with additional operating companies in Pakistan and Bangladesh and large stakes in True (Thailand) and Celcomdigi (Malaysia). It is unclear if the circularity data is at a group-wide, regional or specific operating company level. Data is based on the FY2023 Annual Report.
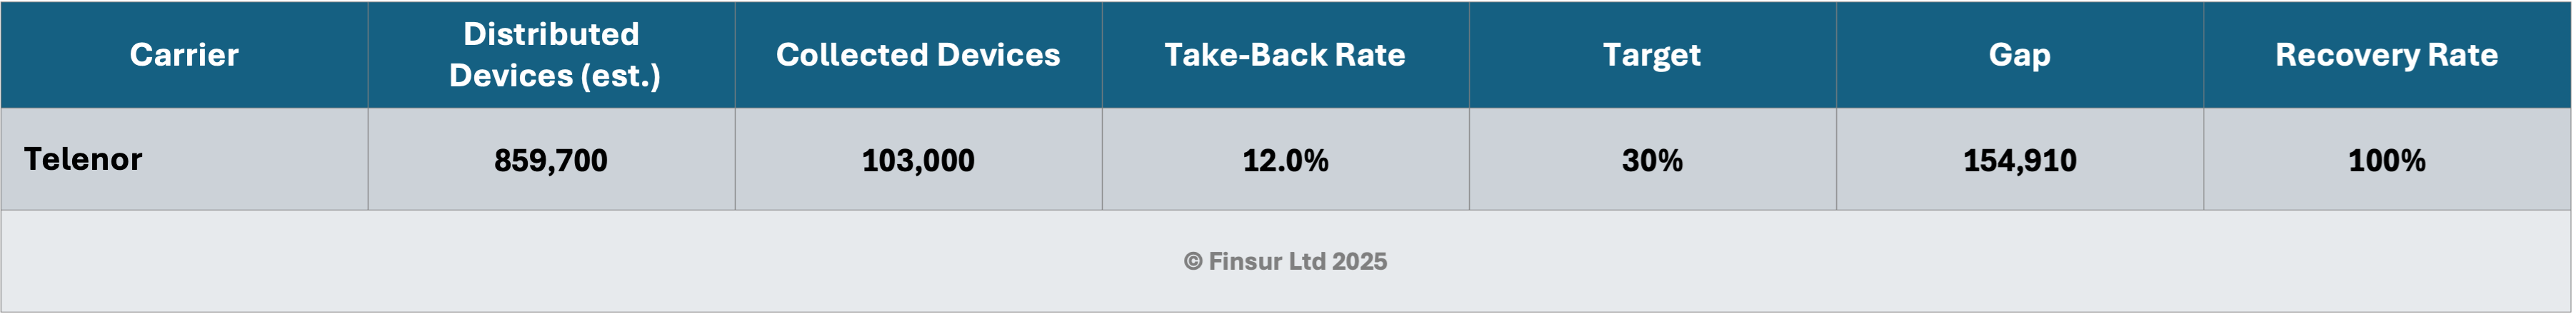
2023 handset sales in the Nordics were approximately NOK 7,442m. At a weighted average for a 60% iPhone, 40% Android market of NOK 8660 is about 859,700 units.
Using the 12% take-back rate provided gives us approximately 103,000 collected devices and a gap of over 150,000 units.
Note the the take-back rate was down from 17% in 2022.
Conclusion
I recognise that in some instances, this review of progress against targets might be a little too soon from a statutory reporting perspective. I also understand that out of all the sustainability commitments and priorities, these particular targets might be relatively far down on the list of the IT projects. However, it’s 18months, almost 2 years since the participants signed up, so the tortoises have some catching up to do, especially with the Japanese hares.
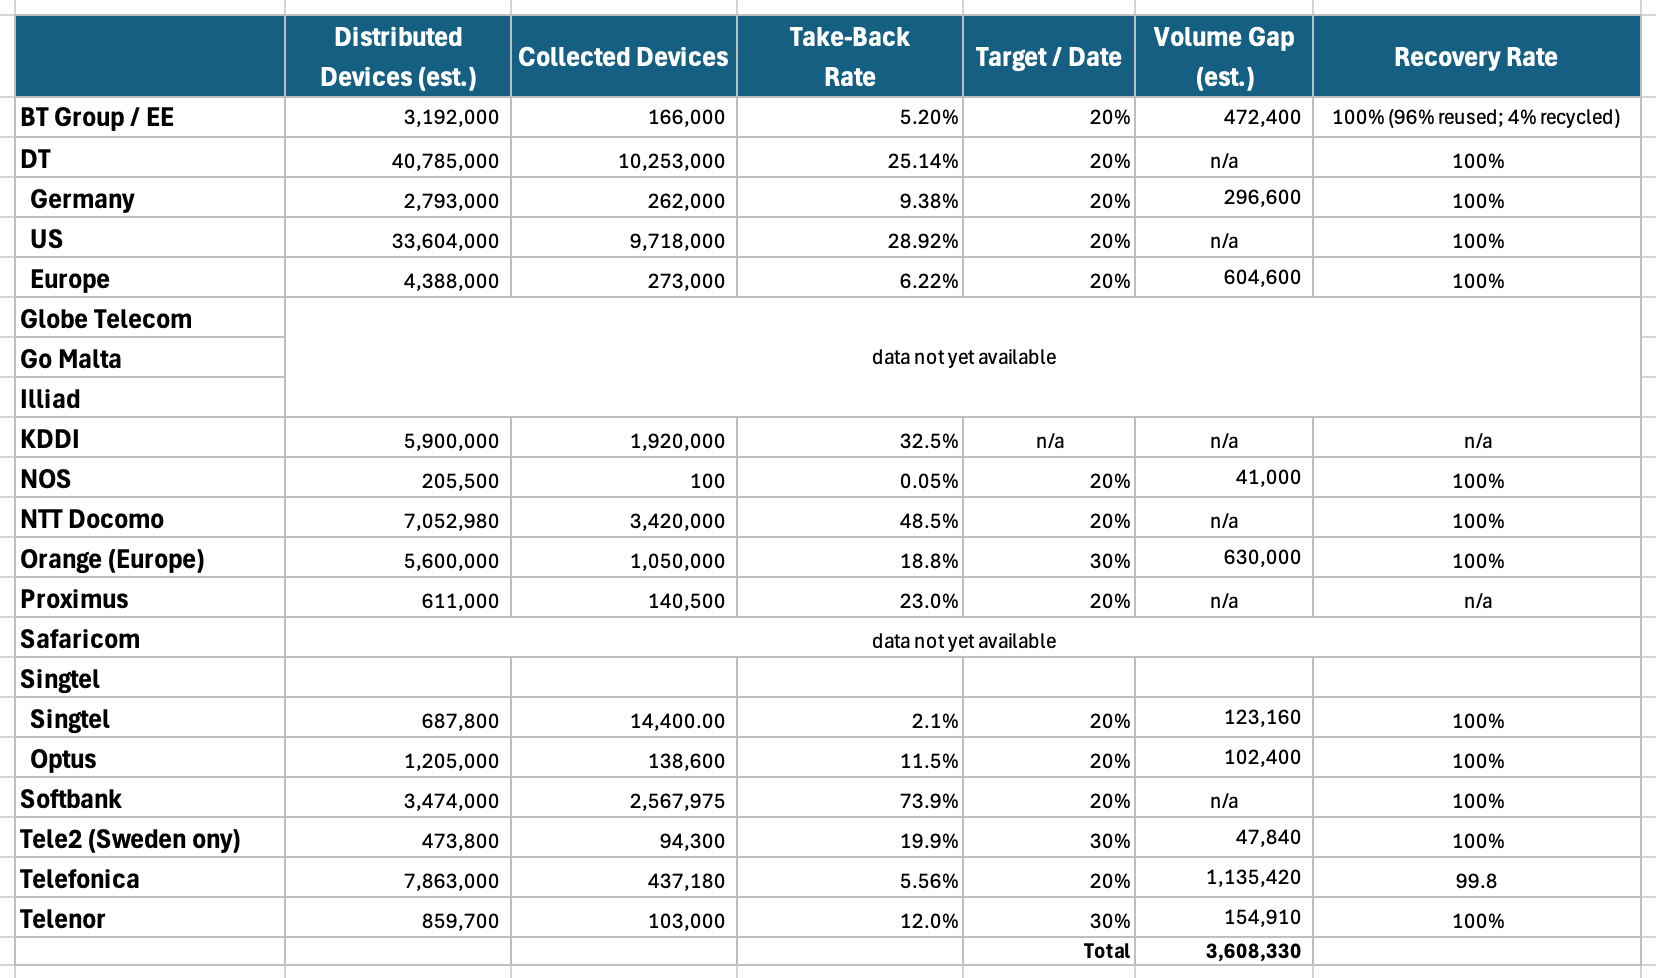
If the above estimations are in the ballpark for the GSMA Pace Setting signatories, there’s a gap of 3.6m devices to collect between now and 2030 (if sales of new devices remain constant). And then, for the opportunists amongst you, there are all the carrier groups that haven’t signed up to the targets. You’d have to assume those positions (gaps) are potentially larger than those committed to the voluntary (as Telefonica reminded me) targets. Perhaps there’s a few trade-in specialists itching to help?
If anyone from the GSMA reads this, it would be extremely useful if the carriers groups would provide data at the operating company level and more rigidly stick to the target definitions when collecting and publishing performance metrics. Unlikely I know, but if you’d like consumers to be able to make choices on responsible practices, this is perhaps one of the easier metrics to connect with. Perhaps the new definitions update will help.
I’m aiming to put out at least one article a week, but this one took longer than expected so just one final request: I’m very grateful to all my subscribers and I’ve recently been keeping articles on the free side of the paywall. So if you’re one a number of regular readers from the same corporate organisations, please consider a paid subscription. Thank you. And another thank you to the most recent paid subscribers. Research does take some time and effort.
Peace,
sb.